POD and PAC Values for Ice Cream Sugars, with Calculator
POD and PAC values for sucrose, dextrose, fructose, invert sugar, lactose, glucose syrup and polyols, a free sugar-balance calculator, and how to read the totals.
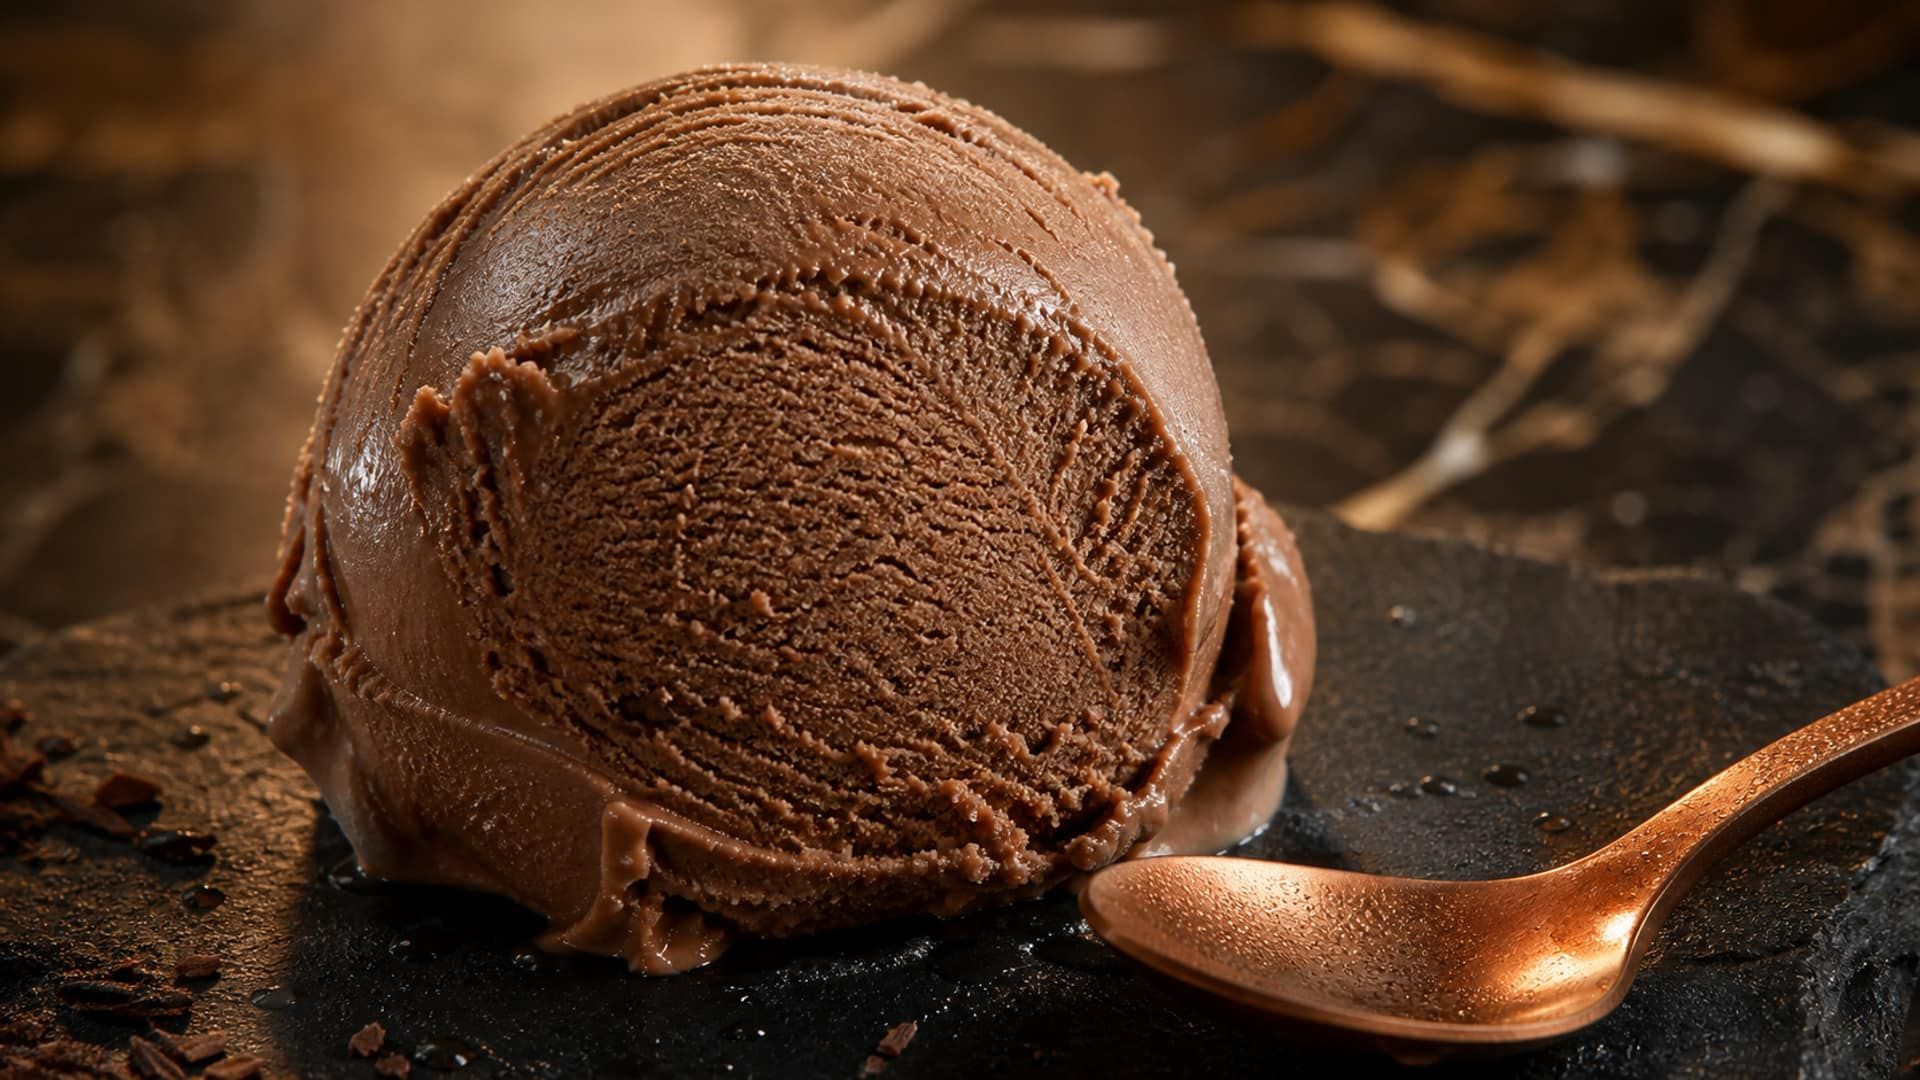
POD measures how sweet a sugar is and PAC how strongly it lowers the freezing point, both with sucrose set to 100. This page holds the coefficient tables the rest of the Formul.io knowledge base links to, plus a calculator that totals them for your own sugar blend.
POD and PAC calculator
Enter the sugars in a batch and the total mix weight. The tool returns POD and PAC per kilogram of mix and shows where each total sits against the band for ice cream, gelato or sorbet. Enter invert sugar and glucose syrup as dry solids, not as sold: the tool’s coefficients are on a dry basis, so 100 g of an 80%-solids syrup goes in as 80 g. It covers the sugars only; build the complete recipe in the full calculator to include dairy lactose, fat, solids and alcohol.
POD and PAC values for common sugars
The first table gives relative sweetness. Published sensory studies disagree, so each row shows the range found in the literature and the single value the Formul.io calculator uses.
| Sweetener | POD range (sucrose = 100) | Formul.io uses | Note |
|---|---|---|---|
| Sucrose | 100 | 100 | Reference by definition |
| Dextrose / glucose | ~70–75 | 75 | Concentration and temperature dependent |
| Fructose | ~120–180 | 173 | 1.2–1.8 times sucrose depending on temperature and concentration |
| Invert sugar (dry solids) | ~120–130 | 125 | Depends on degree of inversion and residual sucrose |
| Lactose | ~15–20 | 16 | Low sweetness, but still a dissolved solid |
| Maltose | ~30–50 | 33 | Source and concentration dependent |
| Glucose syrup DE 42 (dry solids) | ~40 | 30 | Formul.io prices the syrup as one item by its DE, from 0 at DE 5 to 30 at DE 42 (Tetra Pak, Dairy Processing Handbook); a syrup is less sweet than the sum of its sugars |
| Trehalose | ~45 | 45 | Low sweetness at sucrose-like molar mass |
| Sorbitol | ~50–70 | 60 | Polyol |
| Maltitol | ~90 | 90 | Polyol |
| Erythritol | ~60–80 | 70 | Polyol; cooling effect |
Relative sweetness on a dry-solids basis, sucrose = 100.
The second table gives anti-freezing power. Unlike POD, PAC follows from molar mass: a sugar with half the molar mass of sucrose puts twice as many molecules into the water per gram.
| Sweetener | PAC (sucrose = 100) | Basis |
|---|---|---|
| Sucrose | 100 | Reference, 342.3 g/mol |
| Dextrose / glucose, anhydrous | 190 | 180.2 g/mol |
| Dextrose monohydrate, as sold | ~173 | 198.2 g/mol including crystal water |
| Fructose | 190 | 180.2 g/mol, same as glucose |
| Invert sugar solids | 190 | Glucose + fructose solids |
| Lactose | 100 | Disaccharide, anhydrous |
| Maltose | 100 | Disaccharide, anhydrous |
| Glucose syrup DE 42 (dry solids) | ≈80 by molar mass | Average molar mass ≈ 430 g/mol (18016 / DE); Formul.io counts every saccharide, dextrins included, by its moles, which gives ≈80 at DE 42; product-specific with saccharide profile |
| Trehalose | 100 | Disaccharide, anhydrous |
| Sorbitol | ~188 | 182.2 g/mol |
| Maltitol | ~99 | 344.3 g/mol |
| Xylitol | ~225 | 152.1 g/mol |
| Erythritol | ~280 | 122.1 g/mol |
| Glycerol | ~372 | 92.1 g/mol |
| Ethanol | 740 | 46.1 g/mol |
| Salt (NaCl) | ~1170 | 58.4 g/mol, counted as two ions; tables that ignore dissociation give 585 |
PAC on an anhydrous mass basis, sucrose = 100. Values from 100 × 342.3 / molar mass, with salt doubled for its two ions.
Use the PAC column on dry solids. A syrup’s water carries no PAC, so an 80%-solids invert syrup contributes 0.8 × 190 = 152 per gram as sold, not 190.
How to calculate POD and PAC per kilogram
Both totals are weighted sums. Multiply the grams of each sugar’s dry solids by its coefficient, divide by 100, and scale to one kilogram of mix.
Apply the coefficient only to the relevant sweetener solids, not automatically to the entire mass of a syrup or ingredient.
For a 1 kg mix containing 160 g sucrose and 40 g anhydrous dextrose, coefficients of 100 and 75 give 160 + 30 = 190 POD per kilogram. If the dextrose arrives in a syrup, first multiply by the syrup’s dextrose fraction. Coefficient tables copied without their basis cause large errors here.
PAC is an additive bookkeeping index only when all coefficients use the same reference convention.
For a 1 kg mix with 140 g sucrose, 40 g anhydrous dextrose and 60 g lactose, coefficients of 100, 190 and 100 give 140 + 76 + 60 = 276 PAC per kilogram. The mix has the anti-freezing contribution of 276 g of sucrose per kilogram under that convention. Count the lactose from every dairy ingredient: milk, cream and milk powder all add PAC.
What POD and PAC mean, and what they cannot tell you
POD and PAC are practical formulation indices from the gelato trade. POD stands for sweetening power, Potere Dolcificante in Italian and pouvoir sucrant in French. PAC stands for anti-freezing power, Potere Anti-Congelante.
The two indices answer different questions. POD estimates a sweetener’s contribution to sweetness. PAC estimates its contribution to freezing-point depression. Neither is a physical constant: POD shifts with concentration, temperature and the food around it, and PAC tables depend on whether a row describes a dry sugar, a hydrate or a syrup with water in it.
Use the indices as formulation guides
POD and PAC compare candidate formulas. They do not replace a freezing curve, a measured draw temperature, a tasting panel or a storage trial. Record which coefficient table you used and whether each ingredient is entered as dry solids or as sold.
Ice cream is a partly frozen foam. Ice crystals and air cells sit in an unfrozen serum of sugars, proteins, minerals and stabilizers. Sweetener choice changes how many molecules are dissolved, how much water is frozen at a given temperature, and how sweet the product tastes. It does not decide texture alone: fat structure, total solids, proteins, stabilizers, overrun, freezing rate, hardening and temperature cycling all matter too.
POD: a sensory index that depends on the table
A POD of 75 means that, under the conditions behind that table, one gram tastes about 75% as sweet as one gram of sucrose. A tasting panel will not reproduce exactly 75 in every frozen dessert.
Fructose shows the spread most clearly. Published values run from 1.2 to 1.8 times the sweetness of sucrose, so its POD lies anywhere from 120 to 180 depending on temperature and concentration. Gelato tables usually sit near the top of that range, and the Formul.io calculator uses 173. Pick one table, use it for every sugar in the recipe, and confirm the finished product by tasting.
Cold changes perceived sweetness, and not equally for every sugar. Acidity, cocoa, fruit aroma, fat and serving temperature also shift what a taster perceives while the calculated POD stays the same.
PAC: a colligative index
Freezing-point depression is a colligative property: in a dilute ideal solution it depends on the number of dissolved particles per kilogram of water. Glucose and fructose both have a molar mass near 180 g/mol against about 342 g/mol for sucrose, so each gram supplies about 1.9 times as many molecules. On a dry basis both are PAC 190.
A lower coefficient is right for dextrose monohydrate, because part of its mass is crystal water, but the table must say so. A DE 42 glucose syrup holds glucose, maltose, longer saccharides and water; entering all of its mass as glucose overstates PAC.
Ethanol and salt sit far above the sugars because their molecules are so light. Ethanol at 46 g/mol gives about 740. Salt dissociates into two ions, which doubles its count to about 1170. In ice cream, salt belongs at flavour doses; it is not a texture tool.
Why PAC is not a freezing-point equation
PAC cannot be converted to a freezing point with a fixed multiplier. Multiplying PAC 250 by −0.15 would give −37.5°C, while an ordinary ice cream mix starts to freeze only a few degrees below 0°C. PAC is a relative index, not a temperature scale.
For an ideal dilute aqueous solution, Kf for water is about 1.86 K·kg/mol, m is each solute's molality in the water phase, and i is its van't Hoff factor.
Real ice cream is concentrated and non-ideal. Milk salts dissociate, proteins bind some water, syrups hold a spread of saccharides, and every crystal of pure ice that forms concentrates the remaining serum and lowers its freezing point further. A reliable prediction works from the composition of the water phase through a freezing curve or a validated model.
The POD/PAC ratio: 0.55–0.70 as a guideline
The Formul.io ice cream calculator divides POD by PAC and marks 0.55–0.70 as its optimal band. Treat that band as a guideline for a standard ice cream, not as a rule. Above it, sweetness runs ahead of softness: the mix tastes sweet yet sets hard. Below it, the mix is soft for how sweet it tastes, which is typical of dextrose-heavy blends.
Check the totals before the ratio
POD 110 with PAC 190 gives a ratio near 0.58, and POD 176 with PAC 300 gives one near 0.59. Only the second sits inside the calculator’s ice cream bands of POD 150–190 and PAC 260–300. Bring both totals into their bands first, then read the ratio as a summary of the balance between them.
Gelato, hard-pack ice cream, sorbet, soft serve and Pacojet recipes have different serving temperatures, overrun and fat levels. The calculator’s own bands reflect this: gelato runs at POD 150–220 and PAC 250–320, sorbet at POD 250–320 and PAC 280–350. Use the band for your style, and treat any ratio outside 0.55–0.70 as a prompt to check sweetness and hardness in a tasting, not as a fault.
A sugar-balancing workflow
Start with the product and the process. Define the serving temperature, storage temperature, machine, overrun, fat level, total solids and how sweet the product should taste. Then enter each ingredient as used and separate its water from its individual sugars. When the supplier publishes a saccharide profile for a glucose syrup, use it instead of the DE alone.
Calculate POD from one documented table and PAC on one dry-solids convention, and read the totals separately. If the mix is too sweet and too hard, replacing part of the sucrose with dextrose raises PAC while lowering sweetness. If it is too sweet and too soft, more monosaccharide will not help; adjust solids, bulking agents, fat, serving temperature or process.
Run a pilot at the real draw and hardening conditions. Record draw temperature, overrun, hardness after equilibration, meltdown and sweetness, and repeat after temperature cycling, because heat shock coarsens ice crystals without changing calculated POD or PAC.
Lock the exact ingredient specifications. Dextrose monohydrate cannot silently replace anhydrous dextrose, an 80%-solids invert syrup cannot be entered as 100% sugar, and two glucose syrups with the same DE can carry different sugars.
Lactose, sandiness and heat shock
Lactose adds little sweetness but still lowers the freezing point and concentrates in the unfrozen serum. Its low solubility can lead to alpha-lactose crystals and a sandy defect. No single rule such as “9% lactose in the unfrozen water” decides failure or safety; nucleation sites, serum concentration, storage temperature, time, stabilizers and temperature swings all play a part.
The practical controls: avoid excess milk solids-not-fat, count lactose from every dairy ingredient, harden promptly, store cold and steady, and test the intended shelf life.
Ice recrystallization is a separate defect. During a warm excursion some small crystals melt; on refreezing the water joins larger ones. Stabilizers slow this by reducing mobility in the unfrozen phase, but they do not lower the freezing point the way dissolved sugars do. PAC is one part of process control, not the whole of it.
How Formul.io reports these numbers
Formul.io calculates POD and PAC from each ingredient’s composition, including lactose from dairy and the ethanol in spirits, and displays both totals with the POD/PAC ratio. The freezing-point output is an estimate for ordinary frozen-dessert mixes, not a laboratory measurement and not a conversion from PAC.
How to use the estimate
Compare nearby formulations made from well-specified ingredients, then confirm the selected formula with production trials or a measured freezing curve.
A precise-looking decimal cannot make up for imprecise ingredient data. Check every inferred sugar fraction, syrup dry matter and hydrate form. Recipes with unusual alcohol, polyol, mineral or solids levels need a measured freezing curve.
Frequently asked questions
What does POD stand for in ice cream formulation?
Should glucose and fructose have different PAC values?
Can PAC be converted directly into a freezing point?
What is a good POD/PAC ratio for ice cream?
What POD value should I use for fructose?
Does higher PAC always improve heat-shock resistance?
Related Topics
Related Articles
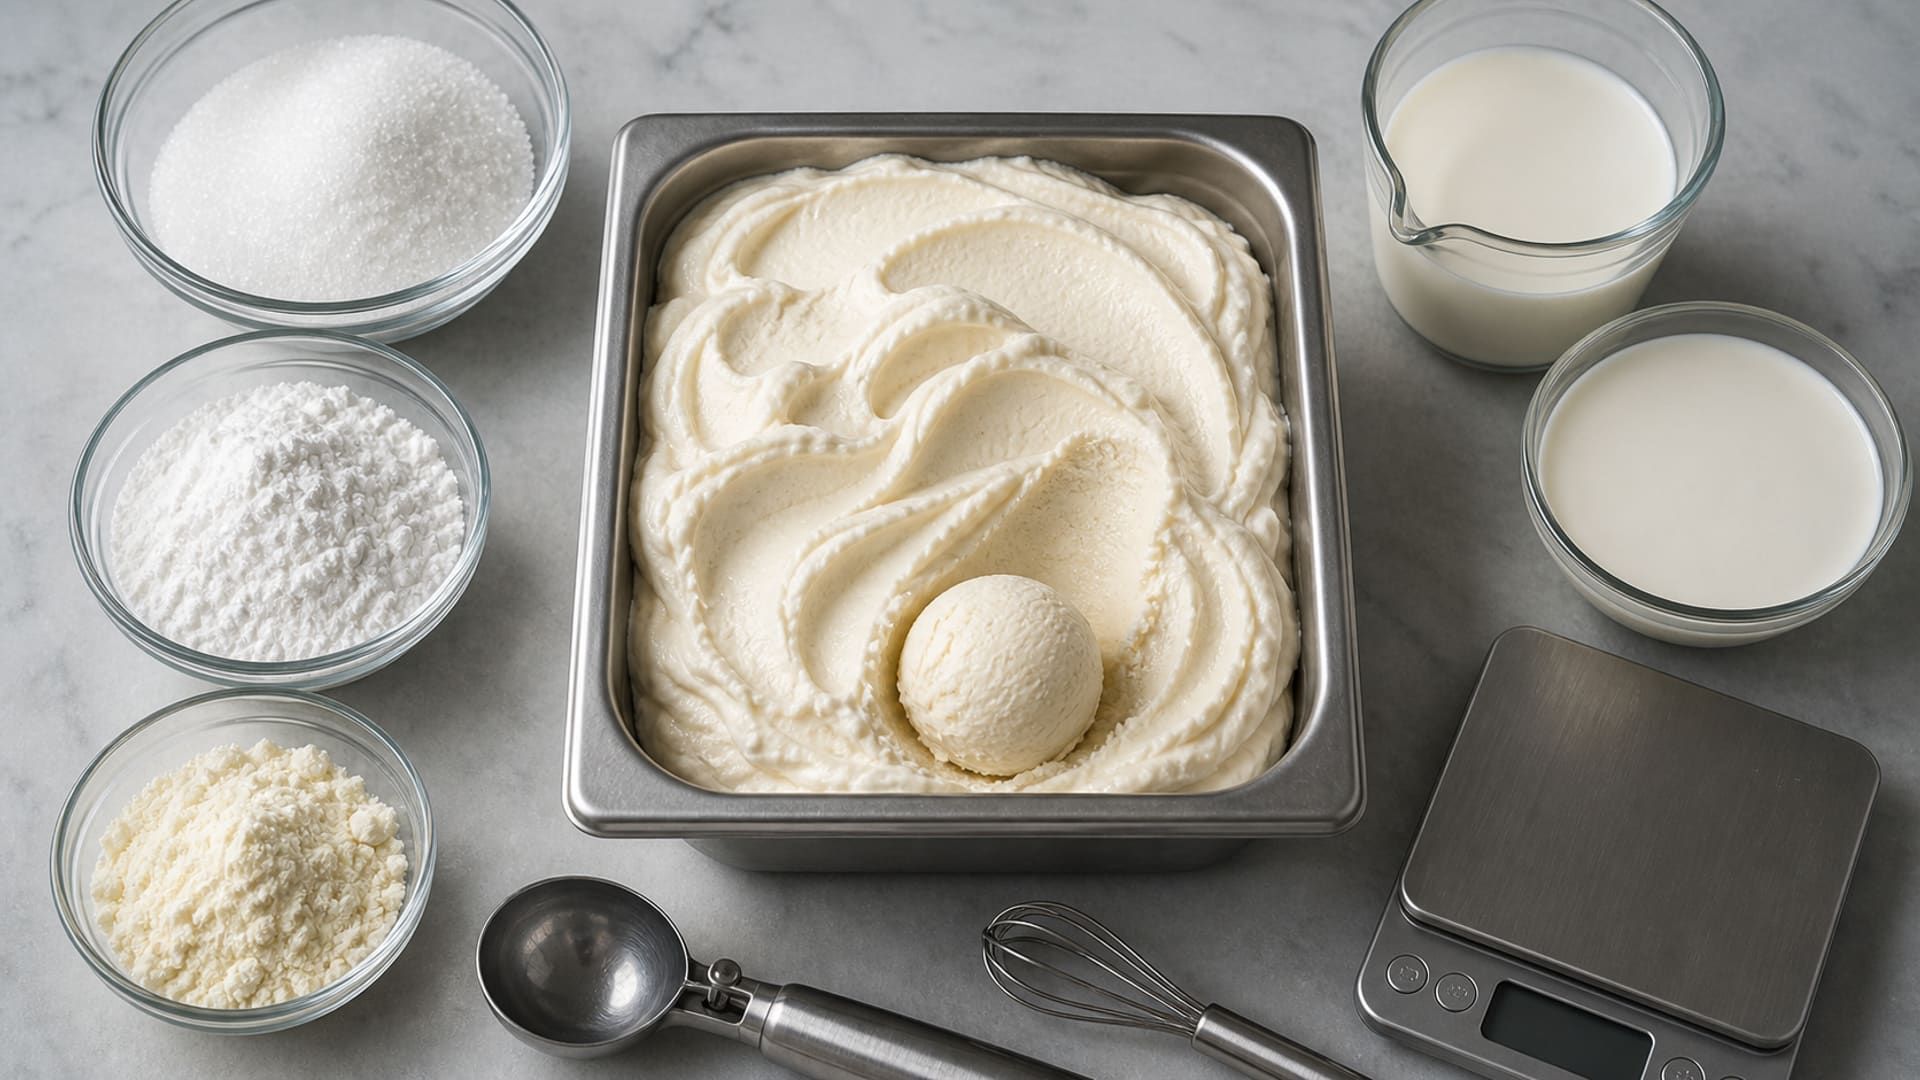
Fior di Latte Gelato: 1 kg PAC Sugar-Balancing Example
Work through a 1 kg fior di latte base to balance PAC, sweetness, solids, serving temperature, and production validation.
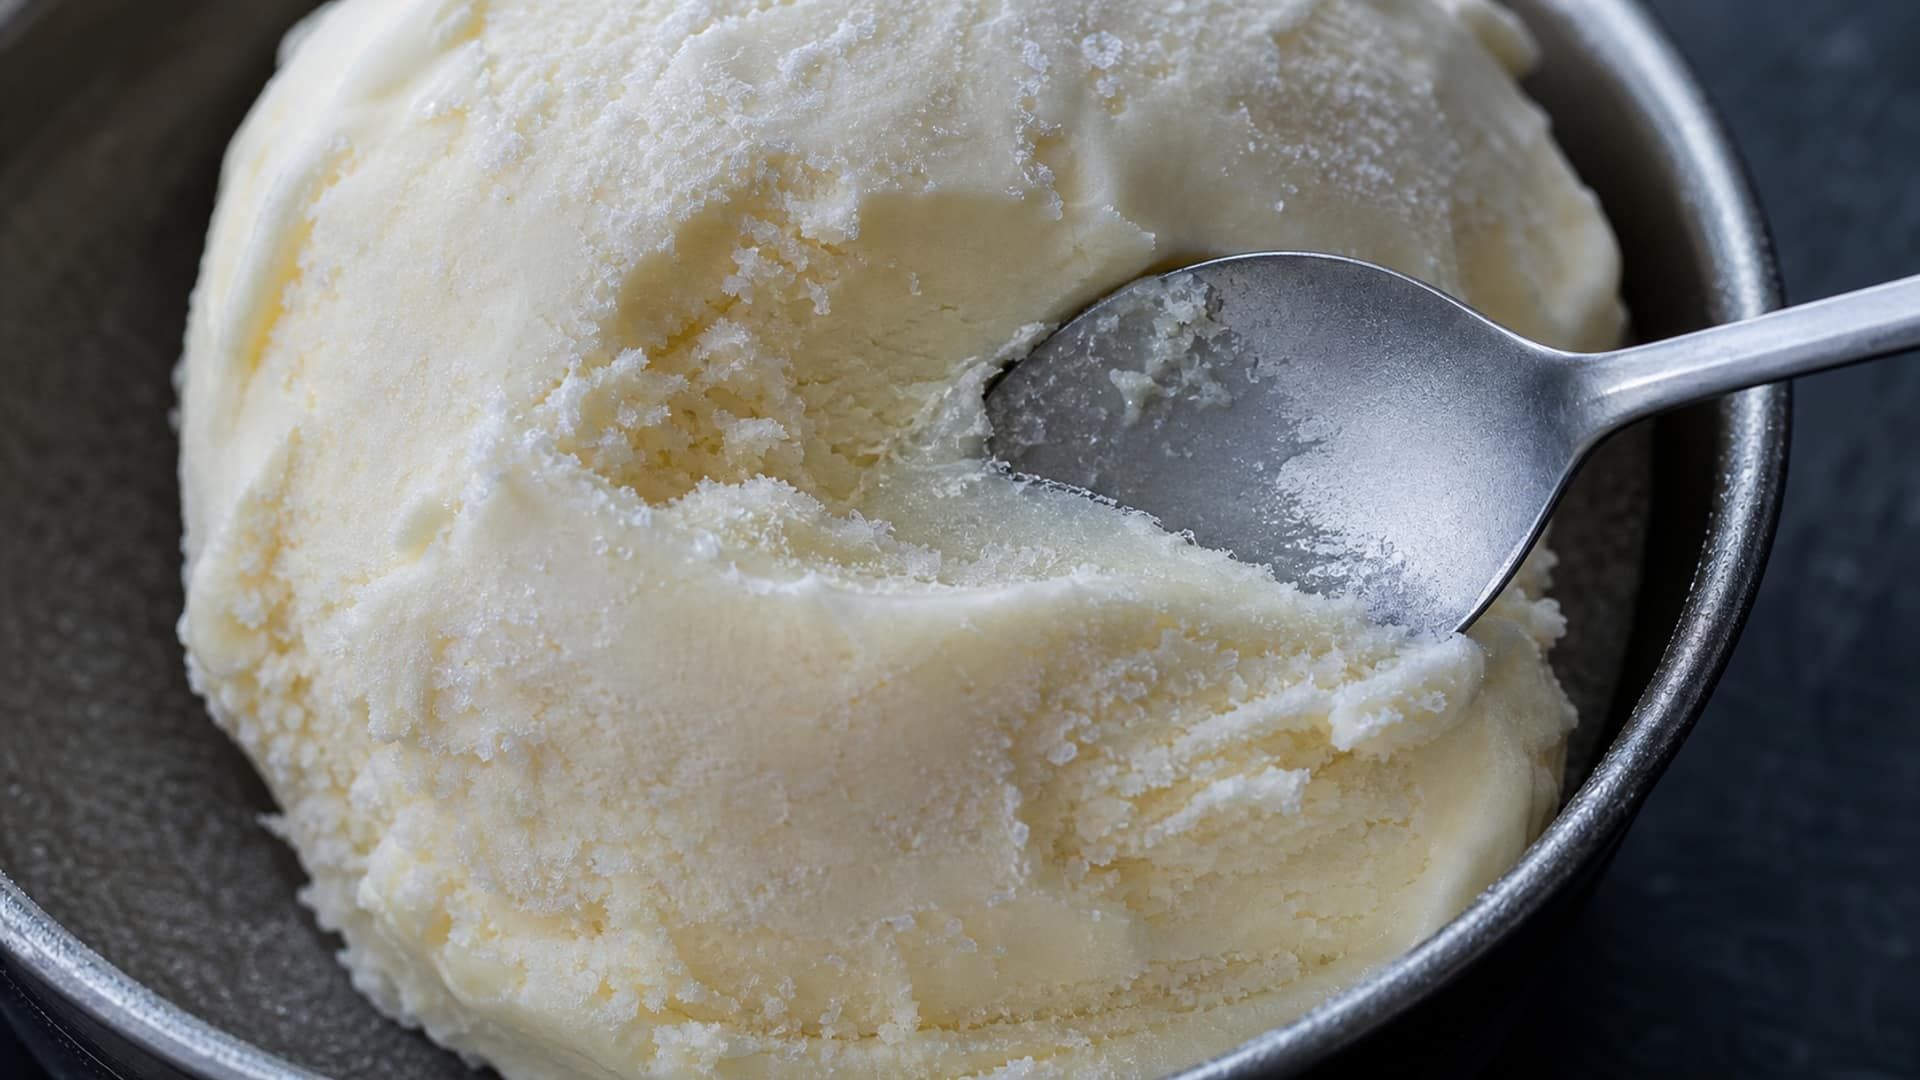
Ice Cream Too Hard or Icy? Find the Cause and Fix It
Rock-hard straight from the freezer and icy after a week are two different faults. Diagnose which one you have, then fix it with sugar swaps, stabilizer and storage.
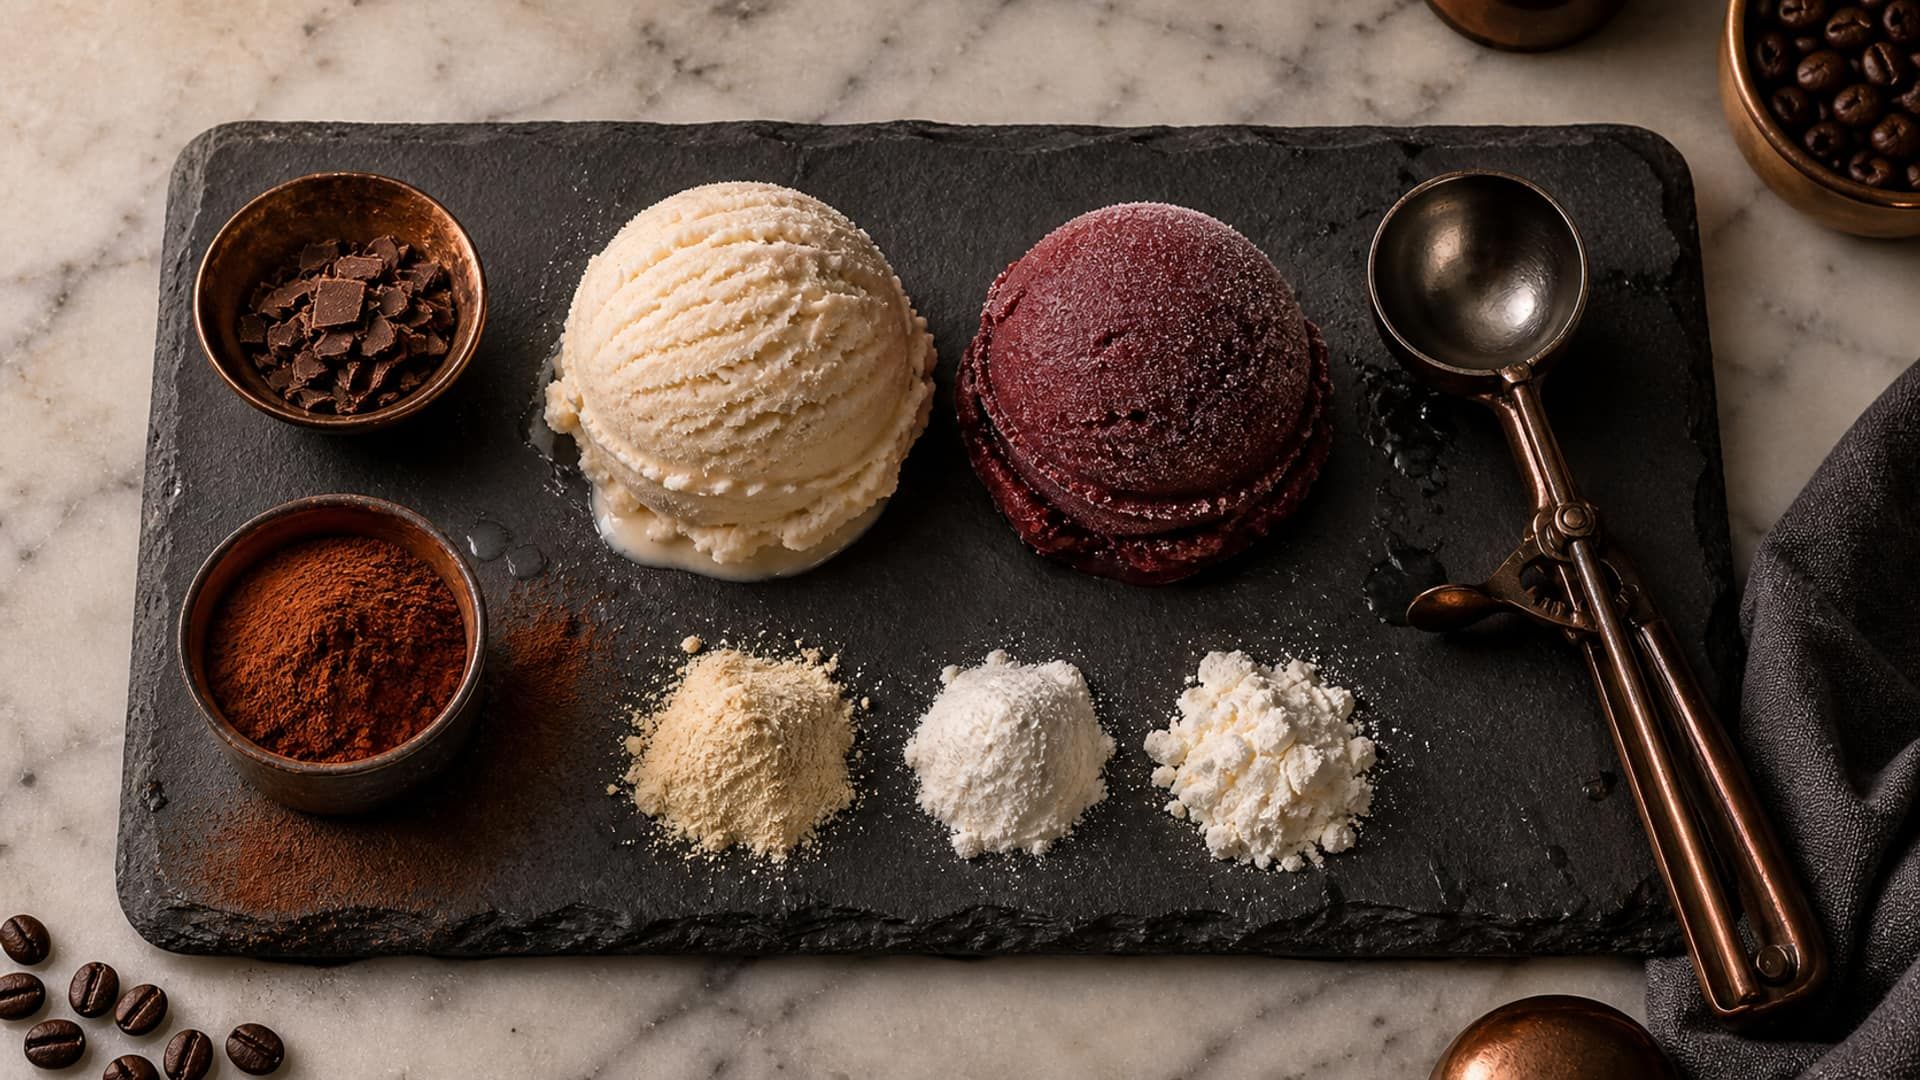
Stabilizing Ice Cream and Sorbet: A Complete Guide
Stabilizing a frozen dessert means controlling water, ice crystals, air, and the unfrozen phase across the whole cold chain. This guide walks the system end to end — building blocks, process, stabilizer choice, and target ranges for both dairy ice cream and dairy-free sorbet.