Caramel Glass Transition: How Moisture Sets Texture
Why a few points of water move a caramel from hard crack to chewy: the glass transition, a Gordon–Taylor table you can recompute, and the water left at each cooking stage.
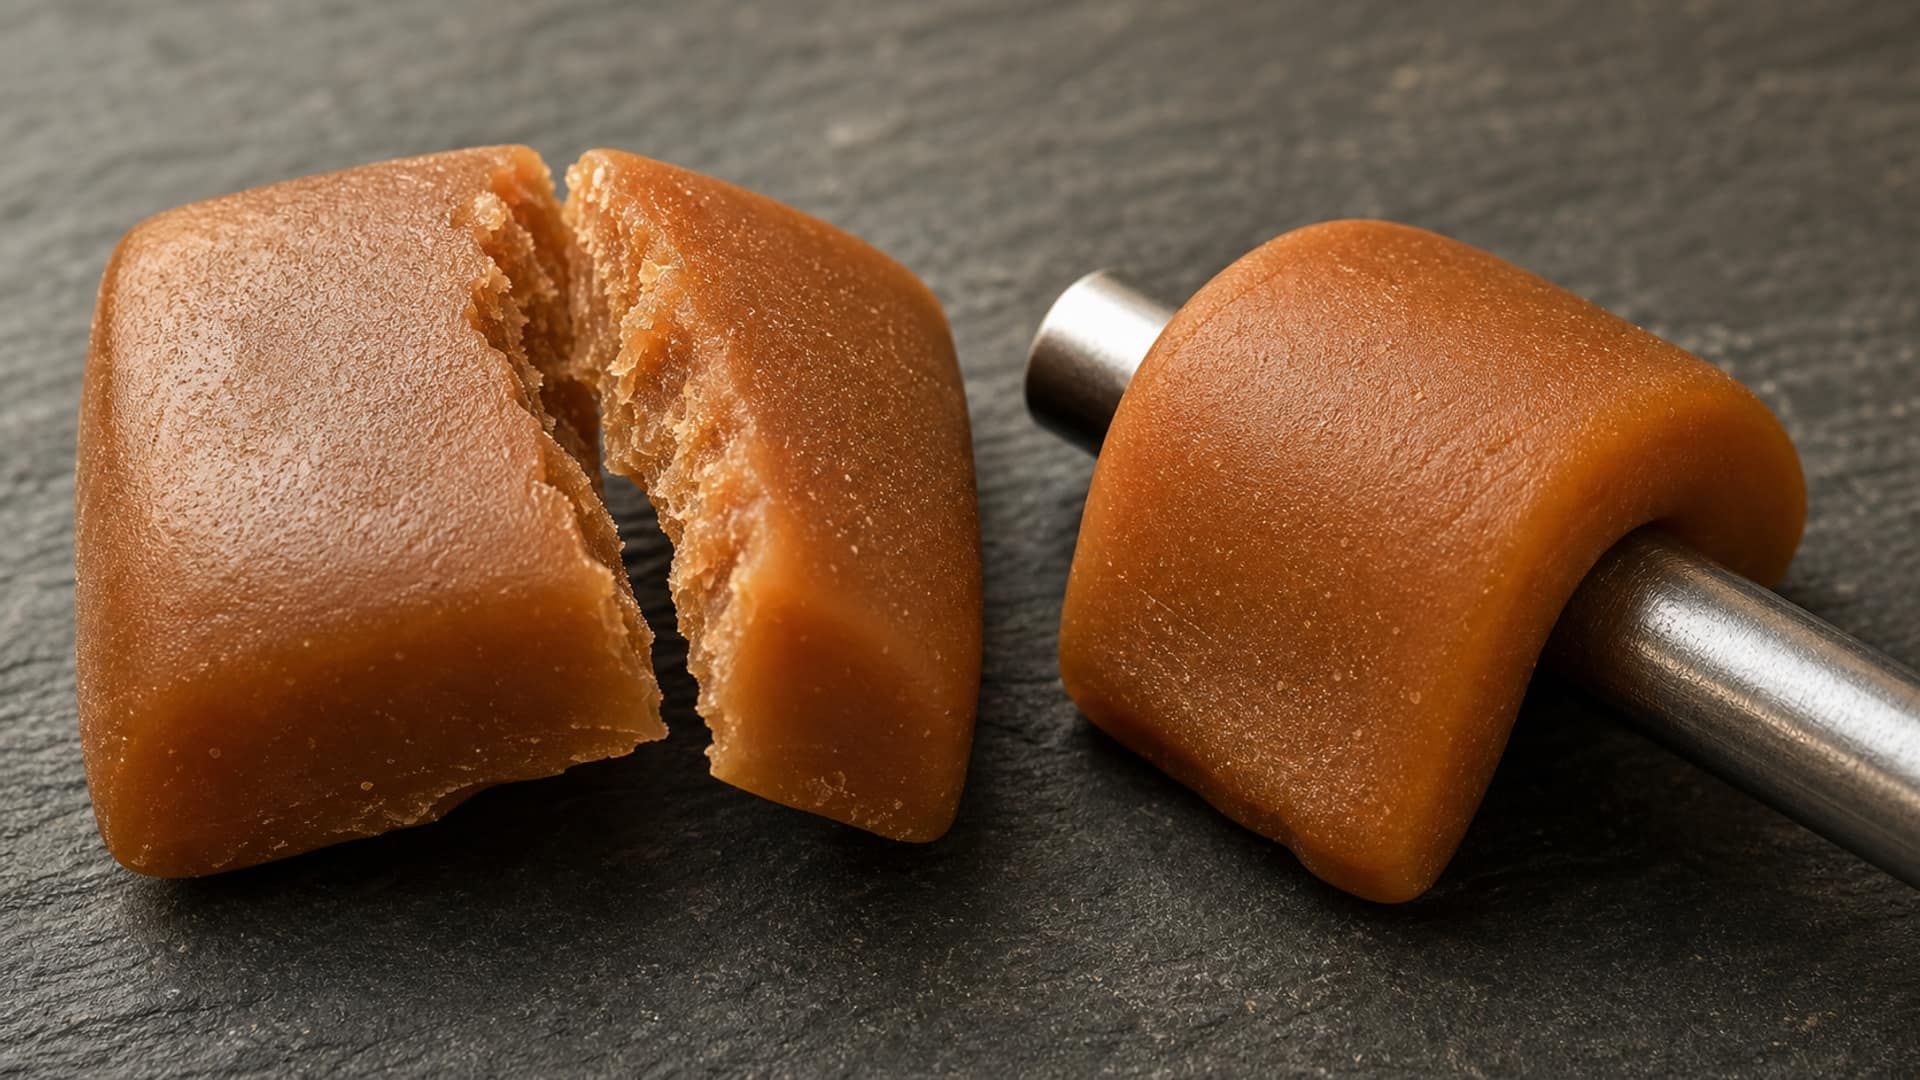
Why Moisture Decides Caramel Texture
The glass transition temperature (Tg) is where an amorphous sugar mass changes from a rigid glass (below Tg) to a soft, rubbery material (above Tg). Water lowers Tg sharply, so the water a caramel keeps after the cook largely decides which side of room temperature its Tg falls on.
Cooking sugar to a higher temperature removes water, and every point of water removed raises the Tg of what is left. A hard candy keeps so little water that its Tg sits well above room temperature: it is a glass and it shatters. A chewy caramel keeps enough water that its Tg sits below room temperature: it is in the rubbery state, which is why it bends, chews and slowly flows if left warm.
Texture therefore follows the gap between the storage temperature and Tg, written T − Tg. Below zero the caramel is glassy; a little above zero it is firm and plastic; far above zero it is soft and sticky. The same caramel can change class without any change to its recipe, simply because the room got warmer.
The Formul.io Caramel Calculator reports a Tg for every caramel. It applies the Gordon–Taylor equation to each dissolved sugar and to the water left after the cook, then compares the result with a 20°C storage temperature and with the window for the texture you chose.
The Gordon-Taylor Equation: Foundation of Texture Prediction
For a sugar phase plus water, the Gordon–Taylor equation estimates the Tg of the mixture from the Tg of each component and a constant k that sets how strongly water plasticises the sugar.
Gordon–Taylor for a sugar–water mixture
Tg = (w₁·Tg₁ + k·w₂·Tg₂) / (w₁ + k·w₂)
w₁ is the mass fraction of sugar solids and w₂ the mass fraction of water. Tg₂ is the glass transition of water, −135°C, and k ≈ 4.7 is the value Roos and Karel reported for sucrose and water. Tg₁ is the dry glass transition of the sugar phase. Pure sucrose glasses at about 62°C. The table below uses 70°C, a sugar phase a little above sucrose, as one rich in glucose syrup solids is: maltose glasses at about 87°C, and the longer chains in the syrup higher still.
| Water in the sugar phase | Calculated Tg | Behaviour at 20°C | State |
|---|---|---|---|
| 2% | +52°C | Hard, brittle | Tg well above storage: glassy |
| 4% | +36°C | Hard candy | Tg above storage: glassy |
| 6% | +23°C | Firm, leathery | Tg ≈ storage: sensitive to small changes |
| 8% | +11°C | Chewy, plastic | Tg below storage: rubbery |
| 10% | 0°C | Soft taffy | Tg well below storage: very soft |
| 12% | −10°C | Very soft, sticky | Tg far below storage: flows |
Gordon–Taylor with Tg₁ = 70°C, Tg₂ = −135°C, k = 4.7. An estimate for comparing formulations, not a measured Tg.
Each extra point of water lowers Tg by roughly 5–8°C in this range, and the step is steepest at the dry end. That is why two degrees on the thermometer, or a humid afternoon, can move a caramel across a texture class.
The water column is water as a share of sugar plus water, not of the whole caramel. In a cream caramel, fat and milk solids sit outside the sugar phase. A caramel with 10% water overall can have 13–14% water in its sugar solution, and it still chews rather than flows, because fat droplets and milk proteins add body the two-component equation does not see. Use the table to compare formulations; confirm a critical Tg by differential scanning calorimetry (DSC).
Tg and Water Activity Answer Different Questions
Tg describes texture: how mobile the sugar matrix is at a given temperature. Water activity (aw) describes stability: whether microbes can grow and which way moisture will move between the caramel and the air. The two move together as you cook, but they are not the same number, and neither can stand in for the other.
The caramel calculator estimates aw from the dissolved sugars treated as one solution, on the water that milk protein and fibre do not hold on their sorption isotherms. It reports a band for each texture: 0.45–0.60 for chewy and firm caramel, 0.60–0.68 for soft caramel, 0.25–0.40 for hard caramel and toffee. A meter reading on the real batch is still what sets a shelf life.
Two formulas with the same water can sit at different aw and different Tg. Smaller molecules depress aw more per gram: sorbitol (182 g/mol) lowers aw more than the same mass of sucrose (342 g/mol), and it also lowers Tg. That is how a humectant buys shelf life without making the caramel harder. Check both numbers in the calculator, then measure aw on the batch.
Cooking Stage Prediction: From Thread to Hard Crack
A sugar syrup’s boiling point rises as it concentrates, a colligative effect. Each stage on the candy thermometer therefore corresponds to a sugar concentration, and so to the water left in the syrup.
| Stage | Temperature (°C) | Sugar in the syrup | Water left | Typical confections |
|---|---|---|---|---|
| Thread | 110–112 | about 80% | about 20% | Syrups, glazes |
| Soft ball | 112–116 | about 85% | about 15% | Fudge, fondant |
| Firm ball | 118–120 | about 87% | about 13% | Soft and chewy caramels |
| Hard ball | 121–130 | about 90% | about 10% | Nougat, firm caramels |
| Soft crack | 132–143 | about 95% | about 5% | Taffy, butterscotch |
| Hard crack | 146–154 | about 99% | about 1% | Brittle, toffee, hard candy |
| Caramel | 160–177 | about 100% | Effectively none | Colour and flavour only |
Candy-thermometer stages for a sucrose syrup at sea level
The chart shows why the stages are uneven. Between thread and hard ball the syrup sheds only about 10 points of water over roughly 15°C. Between soft crack and hard crack each point of water costs about three degrees, and the Gordon–Taylor table shows that the same point moves Tg by 5–8°C. Near the end of the cook, a small temperature error becomes a large texture error.
The calculator works in the same direction as the thermometer. You enter the cooking temperature; it solves how much water the syrup can keep at that boiling point from the batch’s own sugars, then derives Brix, Tg, aw and texture from what is left. Its texture bands follow the stages: soft caramel at soft ball (112–116°C), chewy at 116–121°C, firm at hard ball (121–130°C), hard from 130°C through soft crack (132–143°C) and toffee above that. In a dairy caramel, butter or cream added after the cook brings water back, which is why a chewy caramel is often cooked to firm ball. The chewy salted caramel recipe walks through one such formula degree by degree.
Above hard crack the sugar starts to brown. Colour and flavour from that point on are a matter of caramelization and, when milk proteins are present, Maillard reactions; see Maillard reaction vs caramelization.
Sorbitol and Polyol Effects: Extending Softness
Polyols change texture through the same equation. What matters is each one’s own dry Tg: a small, low-Tg polyol plasticises the caramel like extra water, while a large, high-Tg one behaves much like sucrose.
| Sugar or polyol | Molar mass (g/mol) | Dry Tg (°C) | Effect in a caramel |
|---|---|---|---|
| Maltose | 342 | 87 | Raises Tg; the reason low-DE glucose syrup firms a caramel |
| Sucrose | 342 | 62 | The reference sugar phase |
| Isomalt | 344 | 59 | Holds Tg close to sucrose; used for sugar-free hard candy |
| Maltitol | 344 | 43 | Lowers Tg moderately |
| Glucose (dextrose) | 180 | 31 | Lowers Tg; more aw depression per gram than sucrose |
| Fructose | 180 | 5 | Lowers Tg strongly; hygroscopic |
| Sorbitol | 182 | about −9 | Lowers Tg and aw; keeps a caramel soft |
| Glycerol | 92 | about −80 | Strongest plasticiser and aw depressant per gram |
Dry glass transitions as used by the Formul.io calculators (Roos 1993 for the sugars; published compilations for the polyols)
Three effects follow from the table:
- Lower aw per gram. Sorbitol and glycerol are smaller molecules than sucrose, so the same mass dissolves into more molecules and depresses aw further.
- Lower Tg. With a dry Tg below 0°C, sorbitol keeps a caramel soft at a lower water content than sucrose alone would allow. Maltitol softens only moderately and isomalt hardly at all: their dry Tg (43°C and 59°C) sits far closer to sucrose’s 62°C than sorbitol’s does.
- Less graining. Any second solute gets in the way of sucrose crystallization. For caramels that turn grainy on the shelf, see caramel crystallized during storage.
Labelling: in the EU, a food with more than 10% added polyols must carry the statement “excessive consumption may produce laxative effects” (Regulation (EU) No 1169/2011, Annex III). The caramel calculator does not raise this warning; it flags polyols whose species or quantity it cannot identify. Check the added-polyol share yourself before you label.
Practical Application: Case Study
A confectioner sells a chewy caramel that behaves well in a 20°C shop and needs it to keep the same chew in a 30°C market. The Gordon–Taylor table makes the target explicit.
Read the current position
With 8% water in the sugar phase the table gives Tg ≈ 11°C. At 20°C the caramel sits about 9°C above Tg, which is the chew the customer likes.
Set the new Tg target
To keep the same 9°C gap at 30°C, Tg has to rise to about 21°C. On the same curve that means about 6.3% water in the sugar phase instead of 8%.
Find the cook in the calculator
Raise the cooking temperature a degree at a time and watch Tg and water in the calculator until Tg reaches the new target. The stage table shows the direction: less water means a hotter cook.
Check stability
Less water also lowers aw, which helps. If you add sorbitol to keep softness at a lower water content, recalculate both Tg and aw, and check the added-polyol share against the 10% labelling threshold.
Confirm before production
Measure aw on a real batch, measure Tg by DSC if the market is critical, and run a storage trial at 30°C. The calculation narrows the search; the measurement confirms the shelf life.
The arithmetic is the point: a 10°C warmer market costs less than two points of water in the sugar phase, and a cook that is off by a degree or two eats much of that margin.
Frequently Asked Questions
How accurate is the glass transition temperature prediction?
Why does a chewy cream caramel hold more water than the table's chewy row?
Why does the calculator report both Tg and water activity?
Can the calculator handle honey or other sweeteners?
How do I adjust cooking temperatures for altitude?
What's the difference between soft crack and hard crack caramel?
Related Topics
Related Articles
Chewy Salted Caramel Recipe: 119°C, Brix and Aw
A 663 g chewy salted caramel cooked to 119°C, with the Brix, water and water-activity targets that define the chew, butter and salt timing, and what each degree of the cook does to the texture.
My Caramel Crystallized During Storage
Grainy, sandy, or white caramel that crystallized after production? Learn the five root causes of sucrose graining and how to prevent each one.
Caramelization Temperature by Sugar Type
A condition-aware reference for fructose, glucose, sucrose, maltose, and lactose that separates melting, decomposition, visible browning, and finished caramel colour.