Nougat Texture Science: Moisture, Foam, and Glass Transition
Control nougat texture through syrup concentration, crystallization, aeration, and moisture—with a reproducible Gordon–Taylor example and clear limits for real formulations.
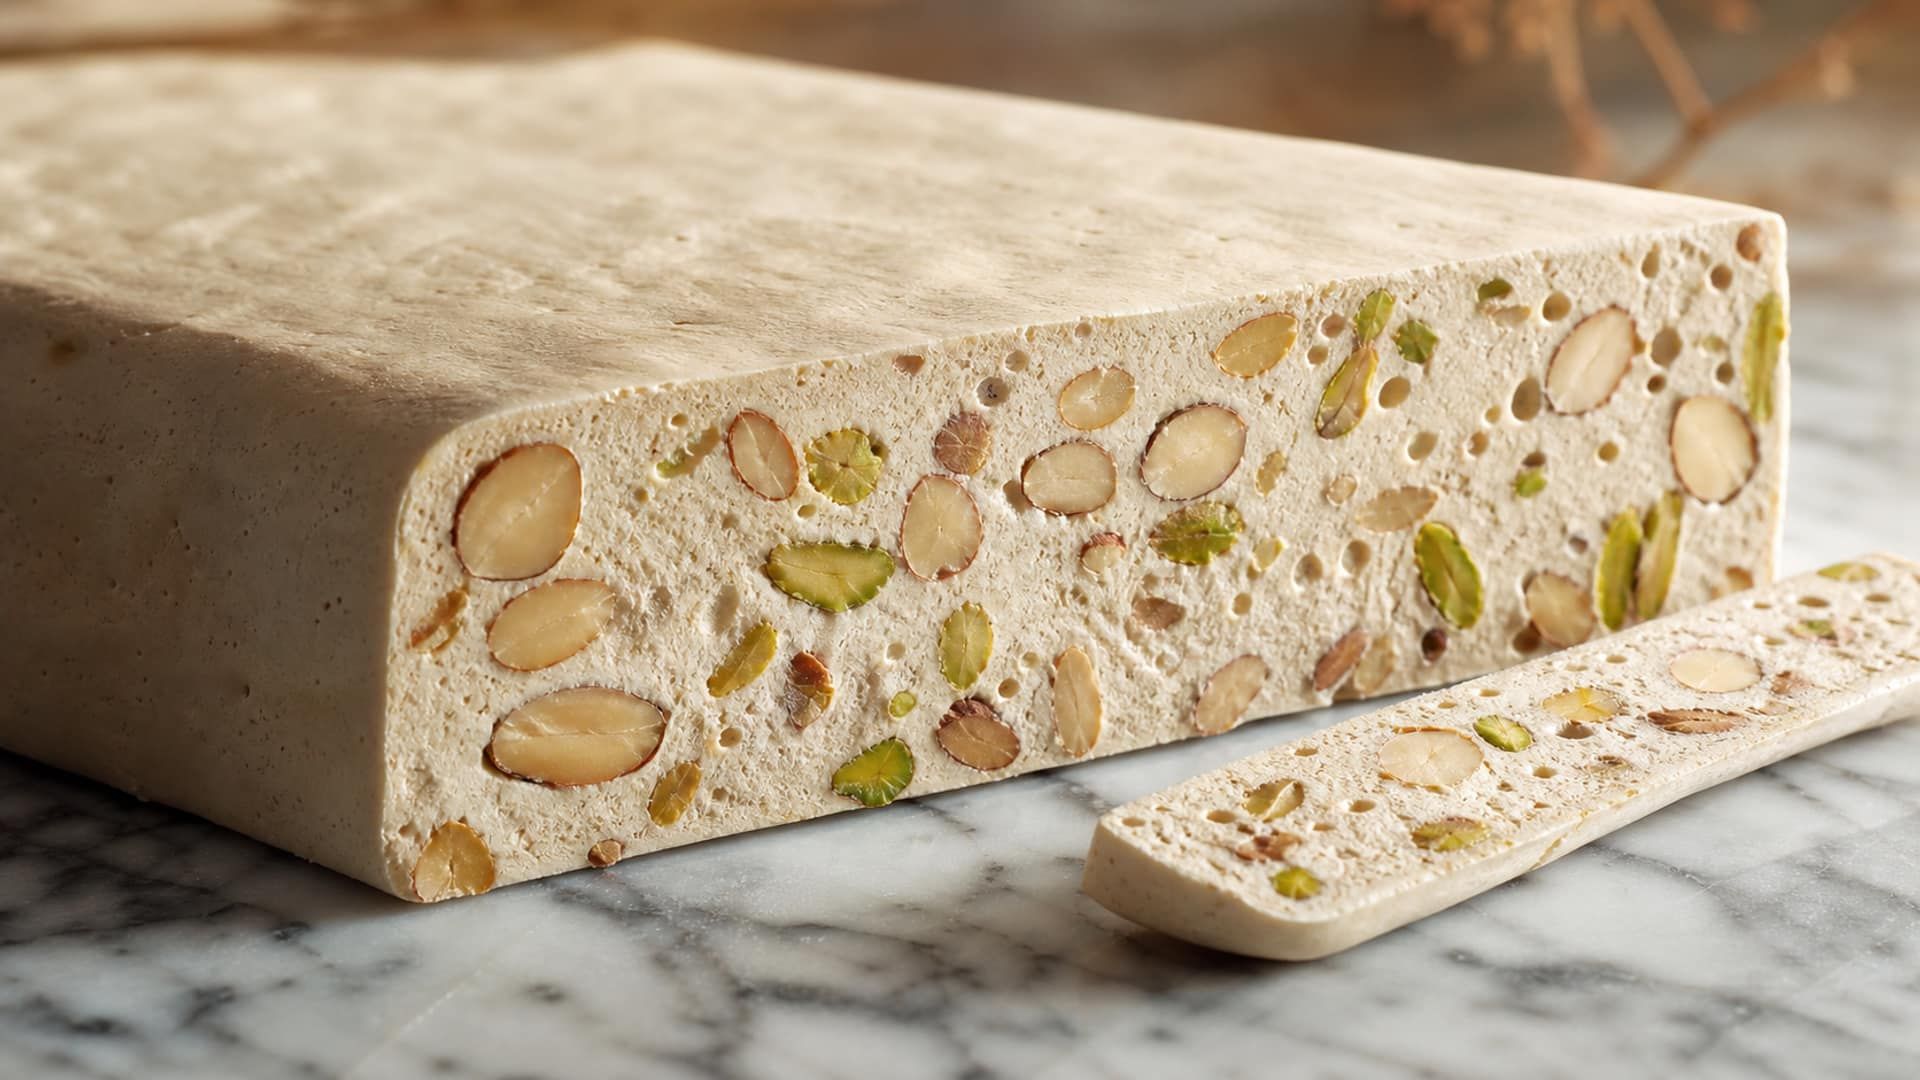
Nougat texture comes from several structures
Nougat is not simply a sugar glass with nuts. Its bite combines a concentrated sugar matrix, an egg-white foam, dissolved and sometimes crystalline sugars, fats from nuts or cocoa ingredients, and dispersed particles. Moisture and temperature change molecular mobility, but foam density, crystal size, sugar profile, and inclusions determine how that mobility becomes a sensory texture.
A hard torrone may be mostly glassy or finely crystallized and fracture sharply. A soft nougat may be above its glass transition at room temperature and deform slowly. Two products at the same moisture can still differ because honey, glucose syrup, invert sugar, proteins, and fats change both water activity and the physical state of the continuous phase.
Use models to compare, then measure the product
The sucrose–water calculations below isolate one effect: water plasticization. They do not predict the exact glass transition or cutting temperature of a complete nougat. Use DSC, moisture, water activity, and texture measurements to validate the finished formula.
The most useful development variables are final moisture, sugar composition, syrup concentration, foam density, mixing energy, deposit temperature, cooling history, nut loading, and storage humidity. Control them together rather than treating one endpoint temperature as a complete specification.
Concentrated syrup and crystallization control
Traditional processes vary, but many nougats combine a cooked sucrose-rich syrup with honey or glucose syrup. Cooking removes water and creates the viscosity needed to stabilize the foam. A hard-crack syrup commonly reaches roughly 149–154°C at sea-level conditions, but temperature is only an indirect indicator of concentration. Barometric pressure, dissolved solids, pan geometry, batch size, probe placement, and heating rate all influence the relationship.
There is no universal conversion between a syrup endpoint error and the resulting moisture, nor a fixed temperature adjustment for extra water in honey. Establish an endpoint curve for the actual recipe by pairing cook temperature with measured final moisture or solids over several batches. Correct for local boiling point and calibrate the probe.
Sucrose crystallization begins with nucleation and continues with growth. Large uncontrolled crystals produce a coarse or crumbly bite. A fully amorphous matrix can instead become sticky when temperature rises above its glass transition. Some nougat styles deliberately develop fine crystals, so “no crystallization” is not always the objective. The target is a controlled state and crystal-size distribution.
Glucose syrup, invert sugar, and honey interfere with orderly sucrose packing. Their effect depends on the actual carbohydrate profile, not only the ingredient name. Lower-DE glucose syrup contributes larger saccharides and viscosity; higher-DE syrup contributes more low-molecular sugars and usually changes sweetness, hygroscopicity, and glass transition more strongly. Honey contains substantial fructose and glucose plus water and variable minor components. Fructose and invert-rich systems are especially hygroscopic; saying only “glucose is more hygroscopic than sucrose” misses the stronger practical contribution of fructose and invert sugar.
| Sugar stream | Main texture function | Development caution |
|---|---|---|
| Sucrose-rich syrup | Builds concentrated continuous phase; may form glass or crystals | Uncontrolled nuclei create coarse texture |
| Lower-DE glucose syrup | Adds viscosity and interferes with sucrose crystallization | Water and solids differ among commercial syrups |
| Invert sugar or fructose-rich honey | Strong crystal interference and moisture affinity | Can lower matrix Tg and increase stickiness at high use |
| Dextrose-rich syrup | Raises molecule count and changes crystallization behavior | May crystallize independently and changes sweetness |
Directional functions; supplier carbohydrate profile and dry solids are required for quantitative formulation.
Egg-white foam and density
Whipping unfolds egg-white proteins and creates films around air bubbles. Hot syrup raises continuous-phase viscosity and heats the foam, while mixing distributes the syrup and changes bubble size. Too little mixing leaves syrup streaks and uneven density. Excessive mixing can collapse bubbles, cool the mass before depositing, or encourage unwanted crystallization on equipment surfaces.
Measure density rather than relying only on mixer time. Use the same cup, temperature, and sampling method for the aerated egg-white phase and final nougat. A density change can explain a batch that feels tougher even when moisture is correct: less air means more sugar matrix per bite and a different fracture path.
Nut temperature also matters. Cold inclusions increase viscosity rapidly and shorten the deposit window; very hot inclusions can prolong fluidity and damage foam. Choose and record a validated inclusion temperature rather than using an unqualified universal range. Coat or precondition inclusions consistently if their surface oils or moisture vary.
Moisture and the Gordon–Taylor example
Glass transition temperature, Tg, marks a range where an amorphous matrix changes from glassy and low-mobility to rubbery and more mobile. It is not a melting point. Texture depends on the difference T − Tg, the observation time, and the complete structure. Crystals, foam, proteins, and fat continue to carry load on both sides of the transition.
For an illustrative binary sucrose–water mixture, the Gordon–Taylor equation is:
w_s and w_w are sucrose and water mass fractions in a binary system. This example uses Tg_s = 62°C, Tg_w = −135°C, and k = 4.7 for sucrose–water.
Roos and Karel obtained k = 4.7 ± 0.2 from sucrose solutions in their studied composition range. Anhydrous amorphous sucrose Tg is reported across roughly 62–70°C depending on preparation and measurement; this worked example uses the lower 62°C value.
At 6% water, w_s = 0.94 and w_w = 0.06:
Tg = [0.94×62 + 4.7×0.06×(−135)] / [0.94 + 4.7×0.06] ≈ 16.5°C
| Water in binary mixture | Calculated Tg | Interpretation at 20°C |
|---|---|---|
| 2% | +44.8°C | Below Tg: binary matrix predicted glassy |
| 4% | +29.7°C | Below Tg: firm binary matrix |
| 6% | +16.5°C | A few degrees above Tg: time-dependent softening likely |
| 8% | +4.8°C | Well above Tg: rubbery binary matrix |
| 10% | −5.6°C | Well above Tg |
| 11% | −10.4°C | Illustrative value, not measured nougat Tg |
| 12% | −14.9°C | Illustrative value, not measured nougat Tg |
Recomputed sucrose–water values using k = 4.7. They are not a specification for real nougat.
For a mixture with 11–12% water, the binary calculation gives approximately −10 to −15°C. Real nougat usually contains glucose syrup, fructose, invert sugar, honey, protein, fat, and nuts. Glucose and especially fructose have much lower dry-state Tg than sucrose, so a sucrose–water calculation can overestimate the sugar phase’s Tg. At the same time, protein foam, crystals, and particles add mechanical structure that the binary equation does not represent. Do not apply a fixed ±3–5°C correction; measure the product by DSC when Tg is a design criterion.
Water is a strong plasticizer, but the sensitivity is not constant. One percentage point of moisture does not always change Tg by 5–7°C. The slope is composition-dependent and becomes especially steep in some low-moisture regions. Report whether moisture is wet-basis or dry-basis and use the same basis in every calculation.
Cooking, mixing, and the cutting window
Final texture is set by a sequence rather than one number. Concentrate the syrups to the validated endpoint, combine them with the foam without uncontrolled crystallization, mix to the density and viscosity specification, add inclusions consistently, deposit before the mass loses flow, and cool under repeatable conditions.
The best cutting condition is product- and equipment-specific. A 38–42°C core range may suit one recipe and slab thickness, but it cannot be transferred unchanged to every nougat. Cutting depends on Tg, crystal fraction, foam density, fat, blade geometry, slab thickness, cooling rate, and required edge quality.
Build a cutting-window study by recording core temperature and time after depositing. At each point, score blade drag, deformation, cracking, edge cleanliness, and dimensional recovery. The acceptable interval, not a single target, becomes the production specification. Use a thin probe placed consistently; surface temperature alone does not represent a thick slab’s core. When a finished slab sticks, drags or crumbles, the bench-side diagnosis is in nougat too sticky to cut.
Slow cooling does not automatically make nougat chewy. It gives molecules and crystals more time to reorganize and may promote graining, while moisture and matrix Tg strongly affect brittleness versus deformation. Excessively rapid cooling can trap gradients or create condensation later. Evaluate cooling together with slab thickness and package timing.
Link process numbers to measured outcomes
For each batch, pair syrup endpoint, finished moisture, water activity, density, core cooling curve, and cutting score. That dataset reveals which process measurement actually predicts the defect.
Water activity, storage, and packaging
Water activity and glass transition answer different questions. Tg helps describe molecular mobility and texture of an amorphous phase. aw helps assess microbial growth potential and the direction of moisture migration. Neither can replace the other.
Published confectionery reviews report nougat aw across roughly 0.40–0.65 and moisture near 5–10%, while formulations vary widely. A practical target around aw 0.55–0.65 can be reasonable for some soft nougats, but it does not guarantee a shelf-life date. Osmophilic yeasts and xerophilic molds can grow at unusually low aw, and post-process contamination, pH, preservatives, oxygen, temperature, and package integrity matter. Validate the finished product through an appropriate food-safety and durability study.
Match package barrier to the failure mode. A high water-vapor barrier reduces moisture gain that causes stickiness and moisture loss that causes hardening. Oxygen and light barriers protect nut lipids from oxidation. Seal and flex integrity matter alongside film datasheets. Store samples through expected temperature and humidity cycles, then measure texture, mass, aw, oxidation, and microbial endpoints.
A development plan for reproducible nougat
Start with a controlled base formula and vary one axis at a time. Compare sugar profiles at equal dry solids, not equal syrup weight. For each trial:
- Record supplier syrup dry solids and carbohydrate profile.
- Calibrate temperature probes and record local boiling point.
- Measure syrup endpoint and finished moisture on a declared basis.
- Measure aw after a defined equilibration time and temperature.
- Measure final density and slab cooling curve.
- Score cutting and texture after identical conditioning.
- Repeat across at least three batches before setting tolerances.
Use the binary Gordon–Taylor curve to understand why water is powerful, then replace it with measured DSC data or a multicomponent model calibrated to the actual sugar blend when quantitative prediction is required. Document the recipe scope and operating range of every process heuristic, and verify it across repeat batches before setting production tolerances.
References
- Roos, Y., and Karel, M. “Amorphous State and Delayed Ice Formation in Sucrose Solutions.” International Journal of Food Science & Technology 26(6), 553–566 (1991).
- Roos, Y., and Karel, M. “Plasticizing Effect of Water on Thermal Behavior and Crystallization of Amorphous Food Models.” Journal of Food Science 56(1), 38–43 (1991).
- Roos, Y. H. “Glass Transition Temperature and Its Relevance in Food Processing.” Annual Review of Food Science and Technology 1, 469–496 (2010).
- Hartel, R. W., Ergun, R., and Vogel, S. “Phase/State Transitions of Confectionery Sweeteners: Thermodynamic and Kinetic Aspects.” Comprehensive Reviews in Food Science and Food Safety 10(1), 17–32 (2011).
- Ergun, R., Lietha, R., and Hartel, R. W. “Moisture and Shelf Life in Sugar Confections.” Critical Reviews in Food Science and Nutrition 50(2), 162–192 (2010).
Frequently Asked Questions
What Gordon–Taylor constant should I use for sucrose and water?
What does the sucrose–water model predict at 11–12% water?
Does a hotter syrup endpoint always make nougat harder?
Can water activity predict nougat texture?
Related Topics
Related Articles
Chewy Salted Caramel Recipe: 119°C, Brix and Aw
A 663 g chewy salted caramel cooked to 119°C, with the Brix, water and water-activity targets that define the chew, butter and salt timing, and what each degree of the cook does to the texture.
Caramel Glass Transition: How Moisture Sets Texture
Why a few points of water move a caramel from hard crack to chewy: the glass transition, a Gordon–Taylor table you can recompute, and the water left at each cooking stage.
My Nougat Is Too Sticky and Won't Cut Cleanly
Sticky nougat that drags, deforms or tears under the knife comes from one of four causes. Diagnose which one you have and fix it, from the syrup cook to the cutting room.