Caramelization Temperature by Sugar Type
A condition-aware reference for fructose, glucose, sucrose, maltose, and lactose that separates melting, decomposition, visible browning, and finished caramel colour.
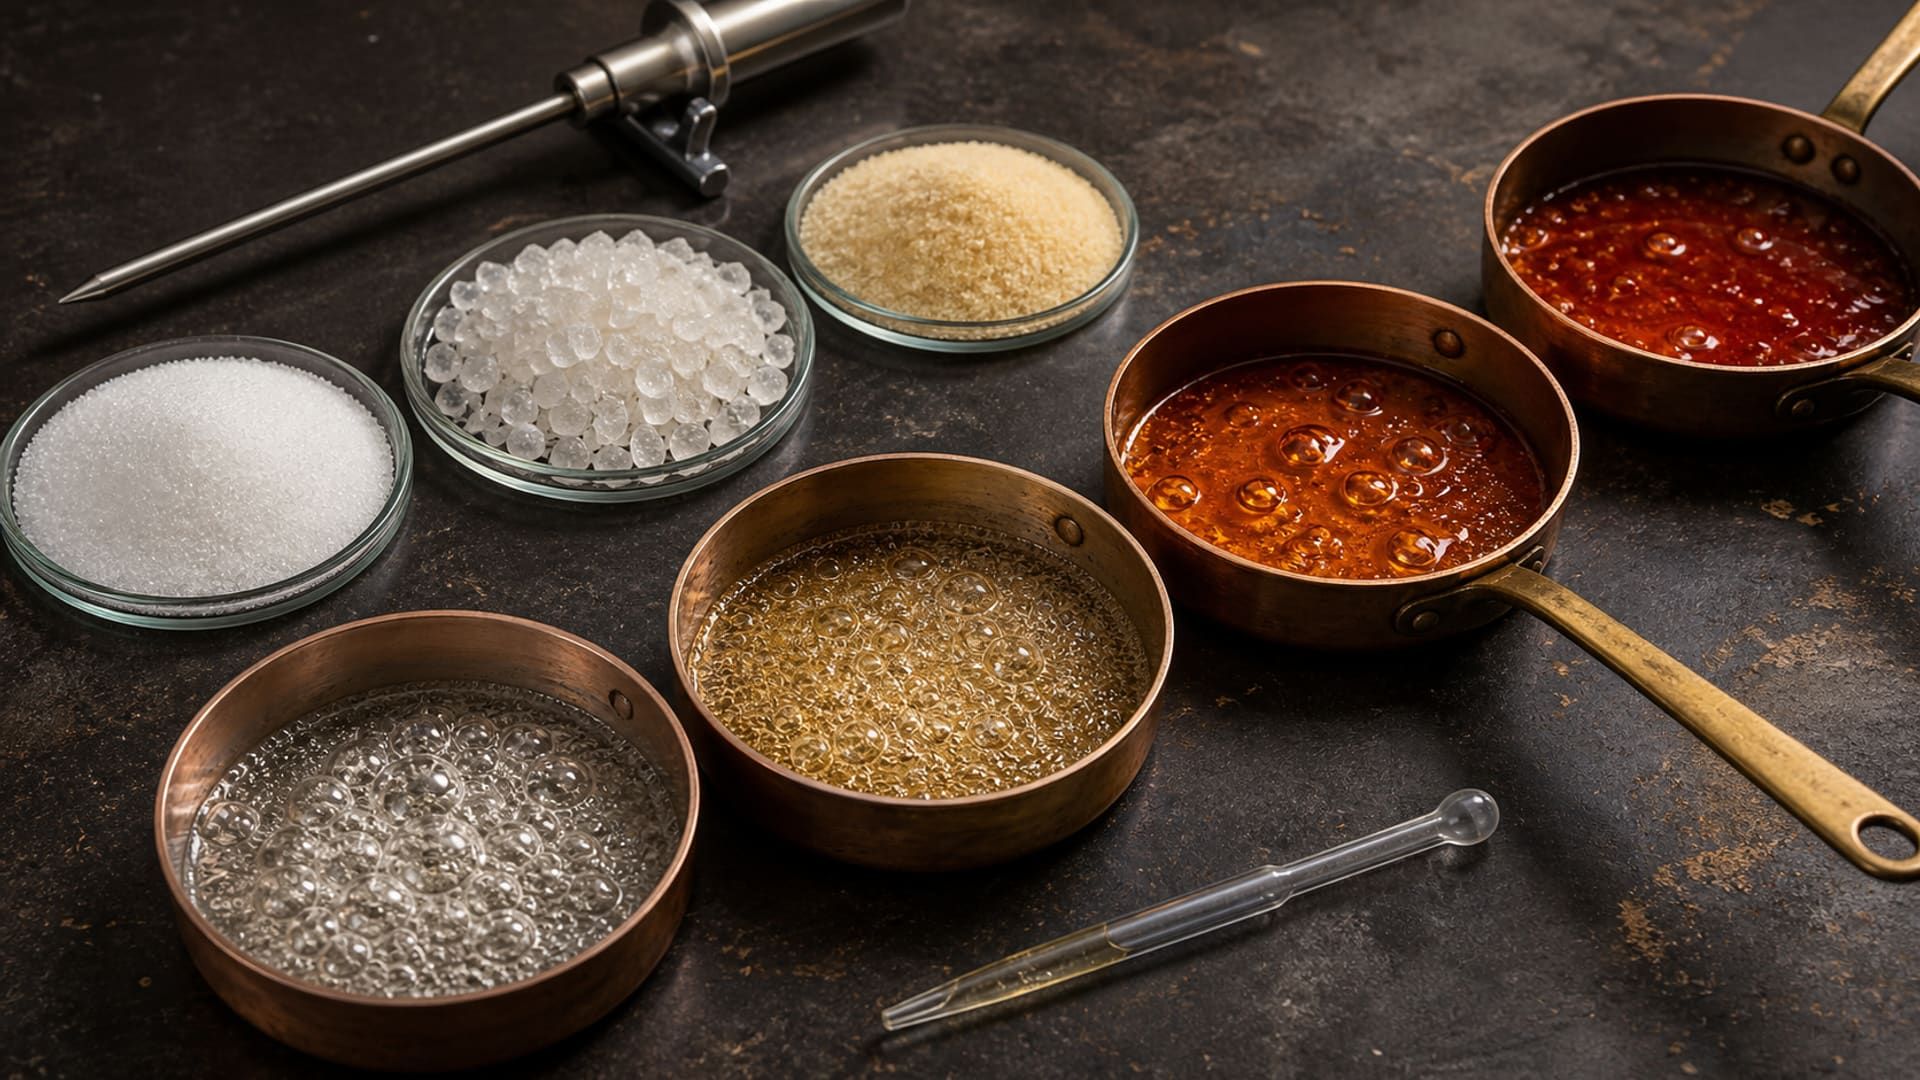
A single caramelization temperature is useful shorthand, but it is not a fixed property like the freezing point of pure water. A sugar may lose crystal structure, begin decomposing, turn pale yellow, develop a measurable brown signal, and reach a useful caramel flavour at different temperatures.
The most defensible answer is therefore a temperature with an endpoint and a process condition attached. Dry fructose heated slowly in a laboratory does not behave like sucrose syrup boiled in a copper pan, and neither behaves like lactose surrounded by milk proteins.
What a Caramelization Temperature Actually Measures
Caramelization is a family of heat-driven reactions in carbohydrates without amino groups as required reactants. Sugar molecules dehydrate, isomerize, fragment, and condense into aroma compounds and progressively larger coloured products; no single bond-breaking event marks the whole process.
Four observations are often collapsed into one number:
- Loss of crystal structure or apparent melting: the solid stops behaving like an ordered crystal, often while decomposition is already occurring.
- Initial decomposition: a thermogravimetric instrument detects the first sustained mass loss under a defined heating program.
- Browning onset: colour or absorbance becomes measurably different from the starting sugar.
- Culinary endpoint: the cook judges aroma, amber colour, bitterness, viscosity, or final solids suitable for the product.
Always name the endpoint
“Sucrose caramelizes at 170°C” can be a practical kitchen reference, but it is not a universal physical constant. State whether the number describes dry-sugar decomposition, visible colour, a syrup endpoint, or a specific analytical method.
Hurtta, Pitkänen and Knuutinen measured dry crystalline sugars by thermal analysis. Their initial decomposition temperatures changed with the programmed heating rate. The chart uses that specific experiment, not a set of kitchen endpoints.
These bars are not six recommended cooking endpoints. They show why an onset temperature must travel with its method: the same sugar can appear to “start” more than 15°C higher when the instrument moves through the range faster.
Caramelization Temperature Chart by Sugar
Read the comparison by method first. The three numeric ranges below come from the same dry-sugar study; maltose, lactose and invert syrup were not tested in that comparison and must not inherit its values.
| Sugar or system | Condition-aware reference | What the range describes | How to use it |
|---|---|---|---|
| Fructose | ~114–137°C | Initial decomposition of dry crystalline fructose at 1–10°C/min in a TG protocol | Expect it to react earlier than glucose or sucrose, but do not equate first decomposition with finished brown caramel |
| Glucose / dextrose | ~152–170°C | Initial decomposition of dry crystalline glucose at 1–10°C/min in the same protocol | Use as a dry-sugar comparison; hydrate form, water, pH, and hold time shift practical browning |
| Sucrose | ~171–189°C | Initial decomposition at 1–10°C/min; its apparent thermal transition was also heating-rate dependent | A wet or dry caramel can colour across a working band rather than at one instant |
| Maltose | No value from this comparison | Not measured in the cited three-sugar experiment | Identify the supplied form and consult a method-specific source before assigning a temperature |
| Lactose | No value from this comparison | Not measured in the cited three-sugar experiment | Do not use browning in milk as a measurement of isolated lactose caramelization |
| Invert sugar syrup | No single pure-sugar temperature | A glucose-fructose mixture whose water content and concentration change continuously during heating | Track solids, bulk temperature, time, pH, and colour together |
Reference temperatures are meaningful only with the stated material, endpoint, heating rate, and moisture condition.
For fructose, the same study reports initial decomposition near 114°C at the slower heating rate and near 137°C at the faster rate. That difference alone is enough to reject a universal cooking instruction derived from one thermal-analysis number.
The study also distinguishes the thermal transition from initial decomposition. Read the definition attached to the column: a DSC heat-flow peak and a TG mass-loss onset are different observations. Keeping both in one unlabeled “caramelization” column discards the distinction that made the experiment useful.
For sugars outside the comparison, missing data should remain missing. An attractive chart with six filled rows is less useful than a smaller chart whose materials and methods can be checked. A reader working with maltose syrup or lactose needs a source that actually describes that material.
Why Water, Heating Rate, and pH Shift the Result
Water changes both temperature history and reaction chemistry. A dilute syrup at atmospheric pressure stays near its boiling range while water evaporates; as solids concentrate, its boiling temperature rises and the sugar-rich phase can progress rapidly toward caramel colour. The temperature at the pan wall can also exceed the well-mixed bulk, so poor agitation may create local dark spots before the probe reports the expected endpoint.
Starting wet is primarily a process choice; it does not turn caramelization into a separate named reaction. It gives sucrose time to dissolve evenly, reduces early hot spots, and changes how long the batch spends concentrating before high-temperature reactions accelerate. Once most free water is gone, a wet caramel can move through the same fast colour sequence as a dry caramel.
Heating rate changes what the thermometer sees. At a slow ramp or a long isothermal hold, reactions have time to accumulate at a lower temperature. With a fast ramp, the sample reaches a higher temperature before the instrument or operator detects the chosen amount of mass loss or colour.
pH changes pathways and rates. Acids can promote sucrose inversion and create glucose and fructose before extensive browning. Both acids and bases can catalyse sugar degradation, but they do not necessarily produce the same aroma or colour distribution. A formulation with lemon juice, dairy minerals, or added bicarbonate cannot inherit the endpoint of neutral pure sugar without a trial.
| Variable | Likely effect on the observed onset | Production control |
|---|---|---|
| More initial water | Delays the rise of bulk temperature while the batch concentrates | Record starting solids and final solids, not temperature alone |
| Faster heating | Often shifts a detected analytical onset upward | Fix batch size, vessel, power, and ramp for comparable trials |
| Longer hold | Allows colour and degradation products to accumulate at lower temperature | Record time inside the critical temperature band |
| Acid | Promotes sucrose inversion and can accelerate selected degradation routes | Control pH and acid addition point |
| Alkali | Can accelerate browning strongly and change flavour | Dose by validated formula; avoid using colour alone as proof of endpoint |
| Impurities and food matrix | Proteins, minerals, other sugars, and surfaces add competing reactions | Validate the complete recipe in the intended equipment |
Concentration also controls mobility. A dry crystal, a supersaturated syrup, and a glassy confection expose molecules to different neighbours and different rates of diffusion. That is why a published pure-sugar value is a starting reference, not a replacement for batch data.
Separate Laboratory Onset From Visible Colour
A second type of experiment helps explain why a saucepan cannot be controlled from the dry-sugar chart alone. Quintas, Brandão and Silva studied colour formation in a concentrated sucrose solution during isothermal heating between 100 and 160°C. Colour developed as a time-dependent result, rather than appearing at a single universal threshold.
Their concentration and controlled hold conditions matter. The observation does not mean every caramel recipe will brown usefully at the low end of that interval. It means a temperature statement needs its accompanying time and material description.
Imagine comparing two records for the same recipe: one reaches an endpoint quickly, while the other spends much longer in the hot concentrated stage. Equal final thermometer readings do not establish equal chemical histories. Compare the duration, final mass and cooled colour before deciding the ingredient was responsible.
Use equal sample thickness and the same lighting when comparing colour. A deep layer in a dark pan can look more developed than a thin cooled sample. Photographing the samples beside a consistent reference makes your record easier to interpret later; it does not turn a phone photograph into a laboratory colour measurement.
For dairy caramel, a separate reaction family also contributes to browning. The distinction between caramelization and the Maillard reaction is covered in the linked guide. Here, the practical consequence is simply that a pure-sugar thermal-analysis table cannot specify the endpoint of a protein-containing recipe.
Maillard Reaction vs. Caramelization
Use the comparison guide for amino compounds, reducing sugars and dairy browning; use this page for interpreting temperature measurements.
Applying the Chart in Production
Treat the chart as a way to design a controlled trial, not as a command to heat every recipe to one number. A useful production specification couples a measurable endpoint with the equipment and formula that produced it.
Name the sugar system
Record each sugar, its supplied solids or hydrate form, initial water, pH, proteins, minerals, acids, and alkaline ingredients. A commercial syrup is not interchangeable with anhydrous glucose.
Choose the endpoint
Define what success means: absorbance or colour standard, soluble solids, moisture, aroma profile, bitterness limit, viscosity, or final texture. Temperature is the process coordinate, not the product specification by itself.
Standardize the heat history
Fix batch mass, vessel geometry, agitation, probe position, heat input, and cooling method. Log time and temperature continuously through the rapid-colour region.
Run a narrow temperature ladder
Pull small samples at several nearby temperatures or times, cool them immediately, and compare them against the same colour and sensory standards after equilibration.
Validate the complete confection
Confirm texture, water activity, flavour, stability, and packaging performance in the finished recipe. The preferred caramel colour is not proof that the final moisture or shelf life is correct.
Keep the reference sample, temperature log and final mass together. Use that record to define the next batch’s endpoint; a generic chart cannot tell you that a changed pan or batch size will finish at the same moment.
Frequently Asked Questions
What temperature does sucrose caramelize at?
Why do charts give different temperatures for fructose?
Can sugar caramelize below its listed temperature?
Does adding water lower the caramelization temperature?
What temperature does maltose caramelize at?
Does milk browning measure lactose caramelization?
Sources: Hurtta, M., Pitkänen, I., Knuutinen, J. (2004), Melting behaviour of D-sucrose, D-glucose and D-fructose, Carbohydrate Research 339, 2267–2273, DOI: 10.1016/j.carres.2004.06.022. Quintas, M., Brandão, T.R.S., Silva, C.L.M. (2007), Modelling autocatalytic behaviour of a food model system—Sucrose thermal degradation at high concentrations, DOI: 10.1016/j.jfoodeng.2005.10.031; and Modelling colour changes during the caramelisation reaction, DOI: 10.1016/j.jfoodeng.2007.03.036.
Related Topics
Related Articles
Maillard Reaction vs Caramelization: What Changes in the Pan?
Maillard browning combines reducing sugars with amino compounds; caramelization transforms sugars without requiring protein. Compare the reactions and use the temperature explorer.
Sugar Types in Confectionery: Which Sugar Does What
Sucrose, glucose syrup, dextrose, fructose, invert sugar, lactose and trehalose compared: which sugar to use in caramel, ganache, fondant, pâte de fruit, ice cream, panning and nougat, and why.
Caramel Glass Transition: How Moisture Sets Texture
Why a few points of water move a caramel from hard crack to chewy: the glass transition, a Gordon–Taylor table you can recompute, and the water left at each cooking stage.