Water Activity in Ganache: The Science Behind Shelf Life Prediction
How the Formul.io Ganache Calculator estimates water activity from a formulation's sugar, polyol, and alcohol composition to predict microbial shelf life — and how to use those numbers responsibly.
Why Water Activity Determines Ganache Success
Water activity (aw) is one of the most important parameters for predicting ganache shelf life. Formally, it is the ratio of the vapour pressure of water in the product to that of pure water at the same temperature: aw = p/p₀ = ERH/100, where ERH is the equilibrium relative humidity the product would create in a sealed headspace.
When you formulate ganache professionally, you are creating a complex emulsion where water availability — not total water content — determines microbial safety. Traditional moisture percentage tells you how much water is present; water activity tells you how much of that water is actually available for spoilage organisms and degradation reactions.
Water activity governs three things: the growth of bacteria, yeasts, and moulds; the rate of many chemical and enzymatic reactions; and moisture migration between components in a composite confection. It does not by itself set sugar or fat crystallization, final texture, or emulsion stability — those are governed by supersaturation, temperature, and the glass transition. This article is scoped to what aw actually controls: microbial shelf life and moisture stability.
That third domain — moisture migration — matters whenever ganache sits against a drier component. Water moves down a water-activity gradient, not a concentration gradient: a ganache at aw 0.85 enrobed in chocolate, or piped into a biscuit shell, will slowly give up moisture to the drier layer until the two equilibrate. That migration softens shells, weeps at interfaces, and can push a filling’s own aw up or down over time. Matching the water activity of adjacent components, or interposing a fat barrier, is the practical defence — and it is another reason aw, not raw moisture percentage, is the number to design around.
The Formul.io Ganache Calculator estimates aw from the full composition of your recipe — sugars, polyols, alcohol, and the water-binding contribution of proteins and fibre — so you can compare formulations before you make them and steer a recipe toward a target shelf life.
The Norrish Model: Non-Linear Sugar–Water Behaviour
At the sugar concentrations typical of ganache, water activity is a strongly non-linear function of the sugar-to-water ratio. A simple linear rule (aw = a + b × moisture) overestimates aw badly once sugar rises above roughly one-third of the water phase, which is exactly the regime professional ganache lives in.
The calculator’s core model is the Norrish equation, which relates water activity to the mole fractions of water and dissolved solutes:
x_w and x_s are the mole fractions of water and dissolved solute; K is a solute-specific interaction constant (larger for sucrose than for glucose or fructose). Multiple solutes are combined with the Ross (1975) product rule, ln(aw_total) = Σ ln(aw_i). See Norrish (1966); the confectionery application is reviewed in Ergun, Lietha & Hartel (2010).
Because Norrish is expressed in mole fractions, it naturally captures why a low-molecular-weight sugar depresses aw more than an equal mass of sucrose, and why the effect accelerates as the water phase becomes crowded with solute. The table below shows how a linear approximation diverges from the mole-fraction model as ganache firms up.
| Sugar:Water Ratio | Linear Estimate | Norrish-Based Estimate |
|---|---|---|
| 1.0 (equal parts) | 0.92 | 0.92 |
| 1.5 (typical ganache) | 0.88 | 0.86 |
| 2.0 (firm ganache) | 0.84 | 0.79 |
| 2.5 (very firm) | 0.80 | 0.71 |
At typical ganache ratios (1.5–2.0), a linear model overestimates water activity by roughly 0.02–0.06 units. Because shelf life depends steeply on aw near 0.85, that gap is enough to turn a safe date code into an optimistic one — which is why the non-linear model matters.
Multi-Factor Corrections: Polyols, Alcohol, Invert Sugar
Real ganache is more than sucrose and water. Polyols, alcohol, and monosaccharides each shift water activity through their own physical chemistry, and the calculator accounts for them on top of the base model:
Polyols (sorbitol, maltitol)
Polyols are more effective at depressing water activity than sucrose at equal mass, because they are smaller molecules and contribute more dissolved species per gram. Replacing part of the sucrose with sorbitol lowers aw and adds plasticising softness. The multi-solute contribution is combined using the Ross (1975) product rule.
Alcohol (rum, liqueurs)
Ethanol lowers water activity through a colligative (mole-fraction) effect, well described by Raoult's law for the water–ethanol phase. At typical ganache levels of a few percent, alcohol contributes a small but real aw reduction on top of its flavour and antimicrobial role.
Invert sugar and monosaccharides (glucose, fructose)
Glucose and fructose depress water activity more than sucrose per gram because their molar mass is about half that of sucrose (180 vs 342 g/mol), so an equal mass provides roughly 1.9× more dissolved molecules. This is a colligative effect of molecule count — not stronger 'binding' by exposed hydroxyl groups.
Very low-moisture fillings
For very firm, low-water centres (praline shells, dense fillings) the sugar-to-water ratio leaves the model's calibrated range. There the calculator switches to a low-moisture treatment anchored on measured behaviour rather than extrapolating the high-moisture curve.
Treat the predicted aw as an estimate for comparing nearby formulations and steering a recipe toward a target — not as a substitute for measurement. For a shelf-life-critical decision, confirm the final recipe with a calibrated water-activity meter on a real batch before committing to a printed date code.
From Water Activity to Shelf Life
Accurate water activity is only useful if you can translate it into a shelf-life expectation. The relationship is not linear: microbial growth rates climb sharply as aw approaches 0.90, so a small reduction in aw buys a disproportionate extension in shelf life. This is the foundational aw–shelf-life principle documented across food-safety literature (see Troller & Christian, Water Activity and Food, 1978).
The table below is computed from the calculator’s Conservative shelf-life model for a ganache with no potassium sorbate: reference days at 4 °C and at 20 °C. The day curve is house calibration, so read it as the shape of the relationship, not a guaranteed date. The default Balanced model lengthens the figures below aw 0.90, by up to 1.6× from 0.85 down, and real shelf life also depends on pH, hygiene, packaging, and storage temperature.
| Water Activity | Refrigerated, 4 °C (Conservative model) | Room, 20 °C (Conservative model) | Notes |
|---|---|---|---|
| 0.92 (very high) | ~2 weeks (14 days) | 3 days | High spoilage risk; needs acid/alcohol or refrigeration discipline |
| 0.87 (high) | ~4 weeks (28 days) | 6 days | Soft ganache with added sugars; moulds, yeasts and S. aureus can still grow |
| 0.82 (moderate) | ~8 weeks (54 days) | 13 days | Pipeable ganache with some sugar/glucose load |
| 0.77 (lower) | ~3 months (101 days) | 26 days | Firm ganache, higher sugar or polyol |
| 0.72 (low) | ~6 months (188 days) | 51 days | Very firm centres; approaching ambient-stable |
Notice that each ~0.05 drop in aw roughly doubles the expected shelf life. That is why a 0.02 error in an aw estimate can shift a shelf-life projection by tens of percent — and why the number is a planning tool to be confirmed, not a promise.
Bound Water vs. Free Water
Not all water in ganache is equally available. Proteins, cocoa fibre, and hydrocolloids such as pectin immobilise a portion of the water in hydration shells, leaving less free water available to support microbial growth. The calculator estimates this free-water fraction and feeds it into the aw model rather than using total water.
Qualitatively: a ganache with meaningful dairy protein, cocoa solids, and a little pectin behaves as though it has somewhat less water than its gross moisture suggests, which measurably extends shelf life at a given recipe. This is a modelling refinement, not a licence to ignore total moisture — the dominant lever remains the sugar-to-water balance.
Practical insight: adding a small amount of a strong water-binder (for example ~0.5% pectin) or increasing dairy solids nudges the free-water fraction down and firms the emulsion. The effect on aw is modest on its own — use it alongside, not instead of, adjusting the sugar and polyol load.
Microbial Safety Thresholds
Because water activity is fundamentally a microbial-safety parameter, the most useful way to read your predicted aw is against the growth limits of the organisms that spoil confectionery. Approximate minimum water-activity levels for growth:
| Organism group | Approx. minimum aw for growth | Relevance to ganache |
|---|---|---|
| Most spoilage bacteria | ~0.91 | Growth-limited below ~0.91; FDA Food Code 2022 treats a measured aw below 0.88 as not needing time/temperature control for safety at any pH |
| Staphylococcus aureus (toxin) | ~0.86 | Toxin production possible down to ~0.86 under aerobic conditions |
| Clostridium botulinum | ~0.93–0.97 | Confined to high-aw, low-oxygen products |
| Most moulds | ~0.80 | The common visible-spoilage risk in soft ganache |
| Xerophilic moulds | ~0.70 | Can grow on firmer, sweeter centres |
| Most yeasts | ~0.88 | Fermentative spoilage, gas, off-flavours |
| Osmophilic yeasts | ~0.60 | Relevant to very high-sugar fillings |
Reading the calculator this way keeps the interpretation honest: a predicted aw of 0.82 tells you bacteria are unlikely to grow but common moulds still can, so refrigeration, hygiene, or a preservative hurdle (acid, alcohol) is doing the real work on your date code.
Putting It Together: A Worked Example
Consider a chocolatier developing a passion-fruit ganache for short refrigerated distribution, targeting roughly three weeks of shelf life with a pipeable consistency. The figures below are the calculator’s estimates with generic ingredient compositions and the Conservative model.
First formula
150 g white chocolate, 120 g passion-fruit purée, 30 g cream. The calculator estimates aw ≈ 0.93, about 12 days refrigerated, because the purée adds a lot of free water. Too short for the target.
Reduce free water, add glucose
Add 30 g glucose syrup and cut the cream to 20 g. Glucose raises the dissolved-solute load, but the purée's water still dominates: the estimate only moves to aw ≈ 0.92, about two weeks. Closer, still short.
Add a humectant and a preservative hurdle
Increase glucose to 40 g, add 20 g sorbitol, ~0.5% pectin to firm the emulsion, and 2% rum. The estimate lands near aw ≈ 0.89, about three weeks refrigerated, while keeping a soft, pipeable texture. The sorbitol does most of the work; the pectin barely moves the estimate.
Confirm before dating
Treat 0.89 as a planning estimate. Before printing a date code, measure the aw of a real batch on a calibrated meter and validate the shelf life with a short storage trial. The calculator narrows the search from a dozen trial batches to a few — it does not replace the confirming measurement.
Used this way, the aw estimate compresses days of iteration into a short, targeted development loop, with the final safety decision anchored on a real measurement.
Frequently Asked Questions
How accurate is the water activity prediction?
Why not use a simple linear water activity model?
Does the calculator account for different chocolate origins and cocoa butter types?
How does it handle invert sugar or honey?
Can I use the calculator for vegan ganache with coconut cream or nut milks?
Does water activity predict ganache texture or crystallization?
Related Topics
Related Articles
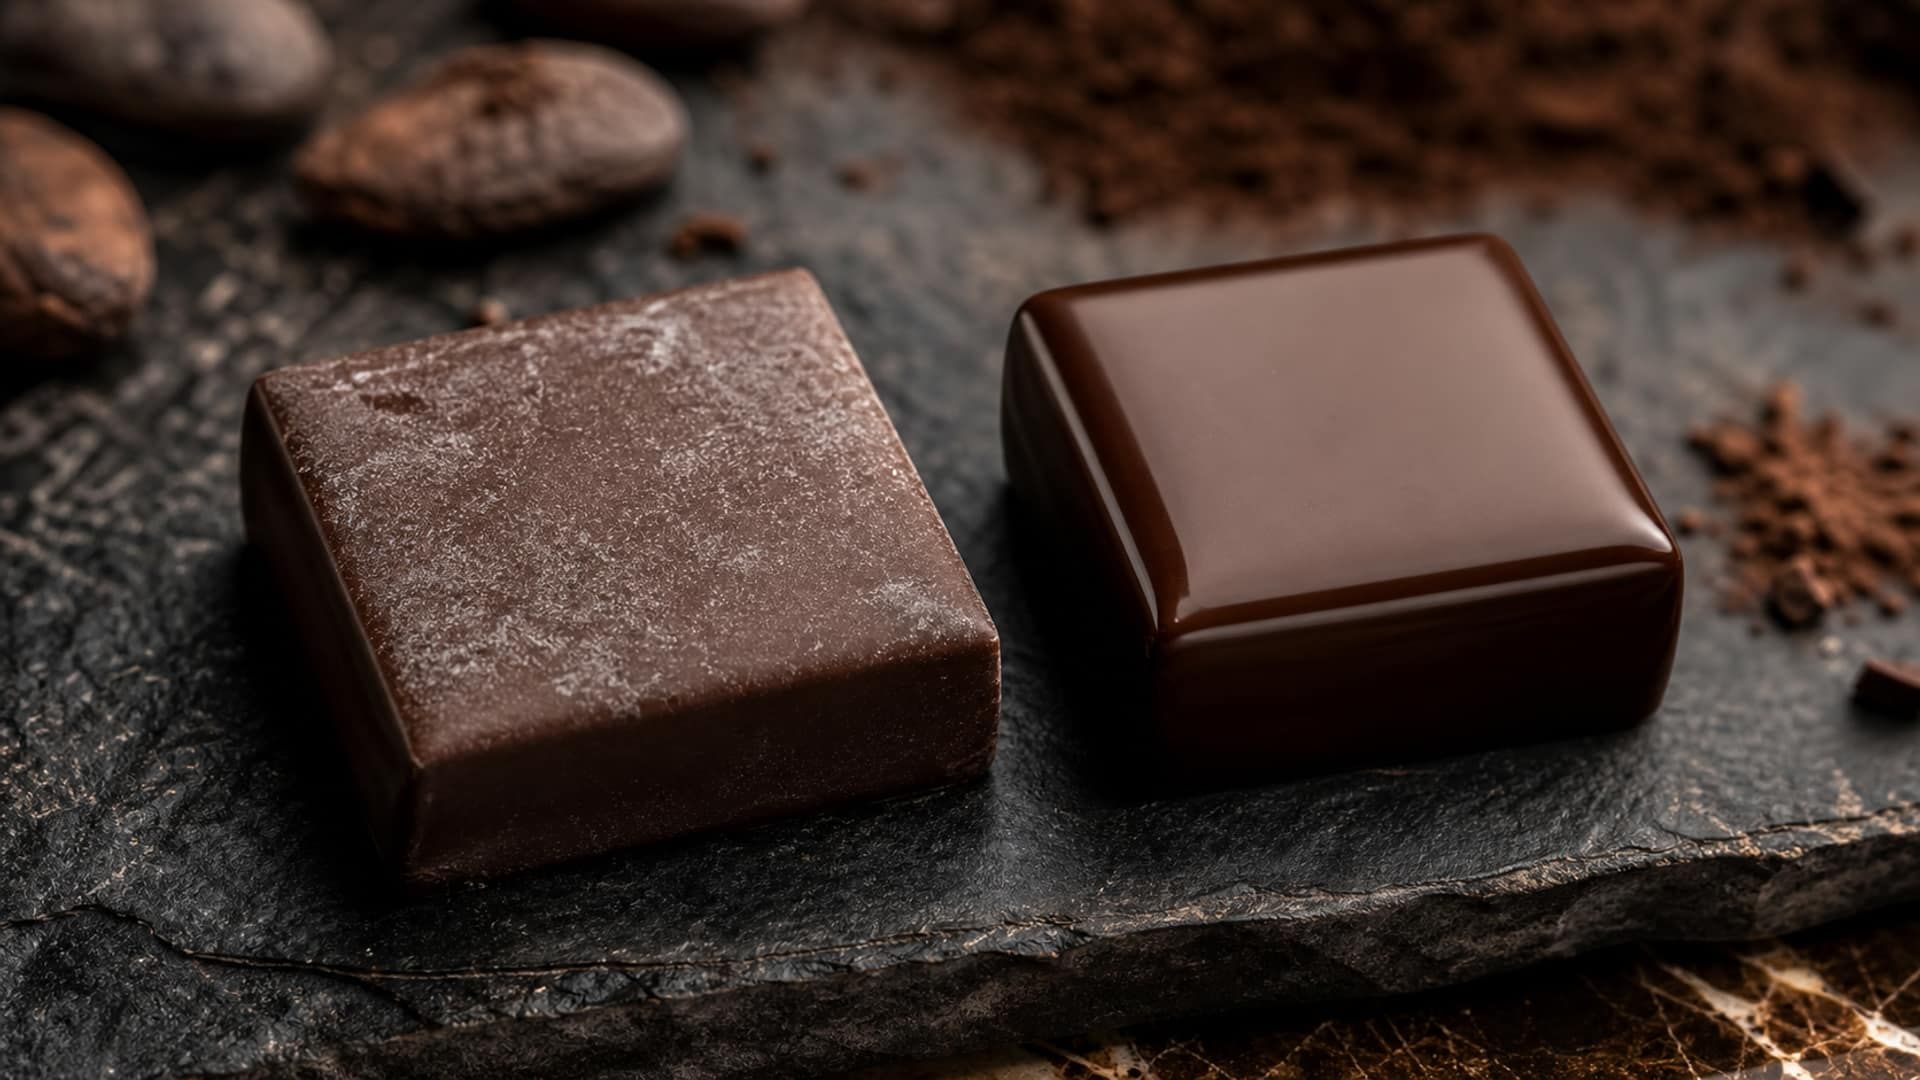
Fat Bloom and Sugar Bloom in Chocolate: Diagnose and Prevent
Distinguish fat migration and polymorphic change from condensation-driven sugar bloom, then control temper, storage, and dew point.
Glucose Syrups and Dextrose Equivalent Explained
Comprehensive analysis of glucose syrups, Dextrose Equivalent (DE) impact on confectionery formulations, and the functional differences between syrup and powder forms.
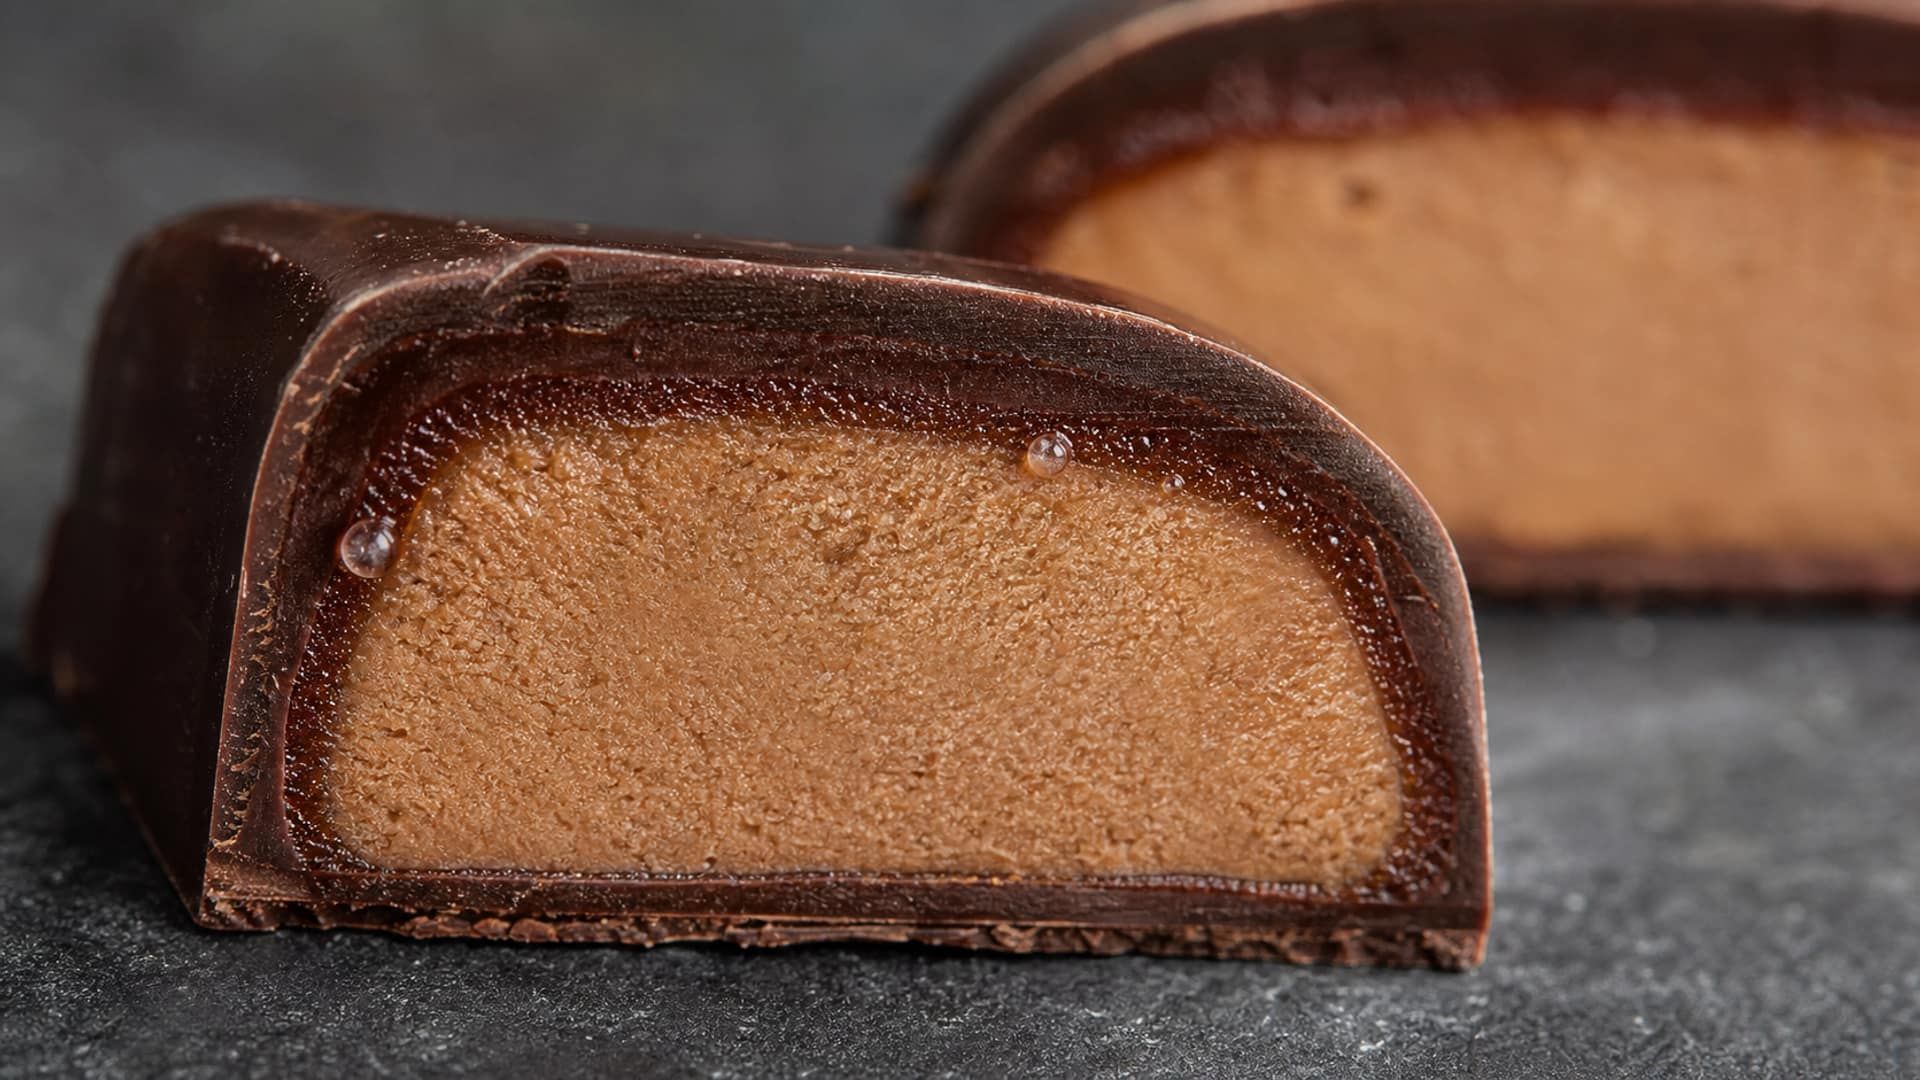
Moisture Migration: Water Activity, Fick's Law, and Packaging
Predict moisture movement by separating its water-activity driving force from diffusion rate, and compare packaging only with WVTR units and test conditions attached.