Moisture Migration: Water Activity, Fick's Law, and Packaging
Predict moisture movement by separating its water-activity driving force from diffusion rate, and compare packaging only with WVTR units and test conditions attached.
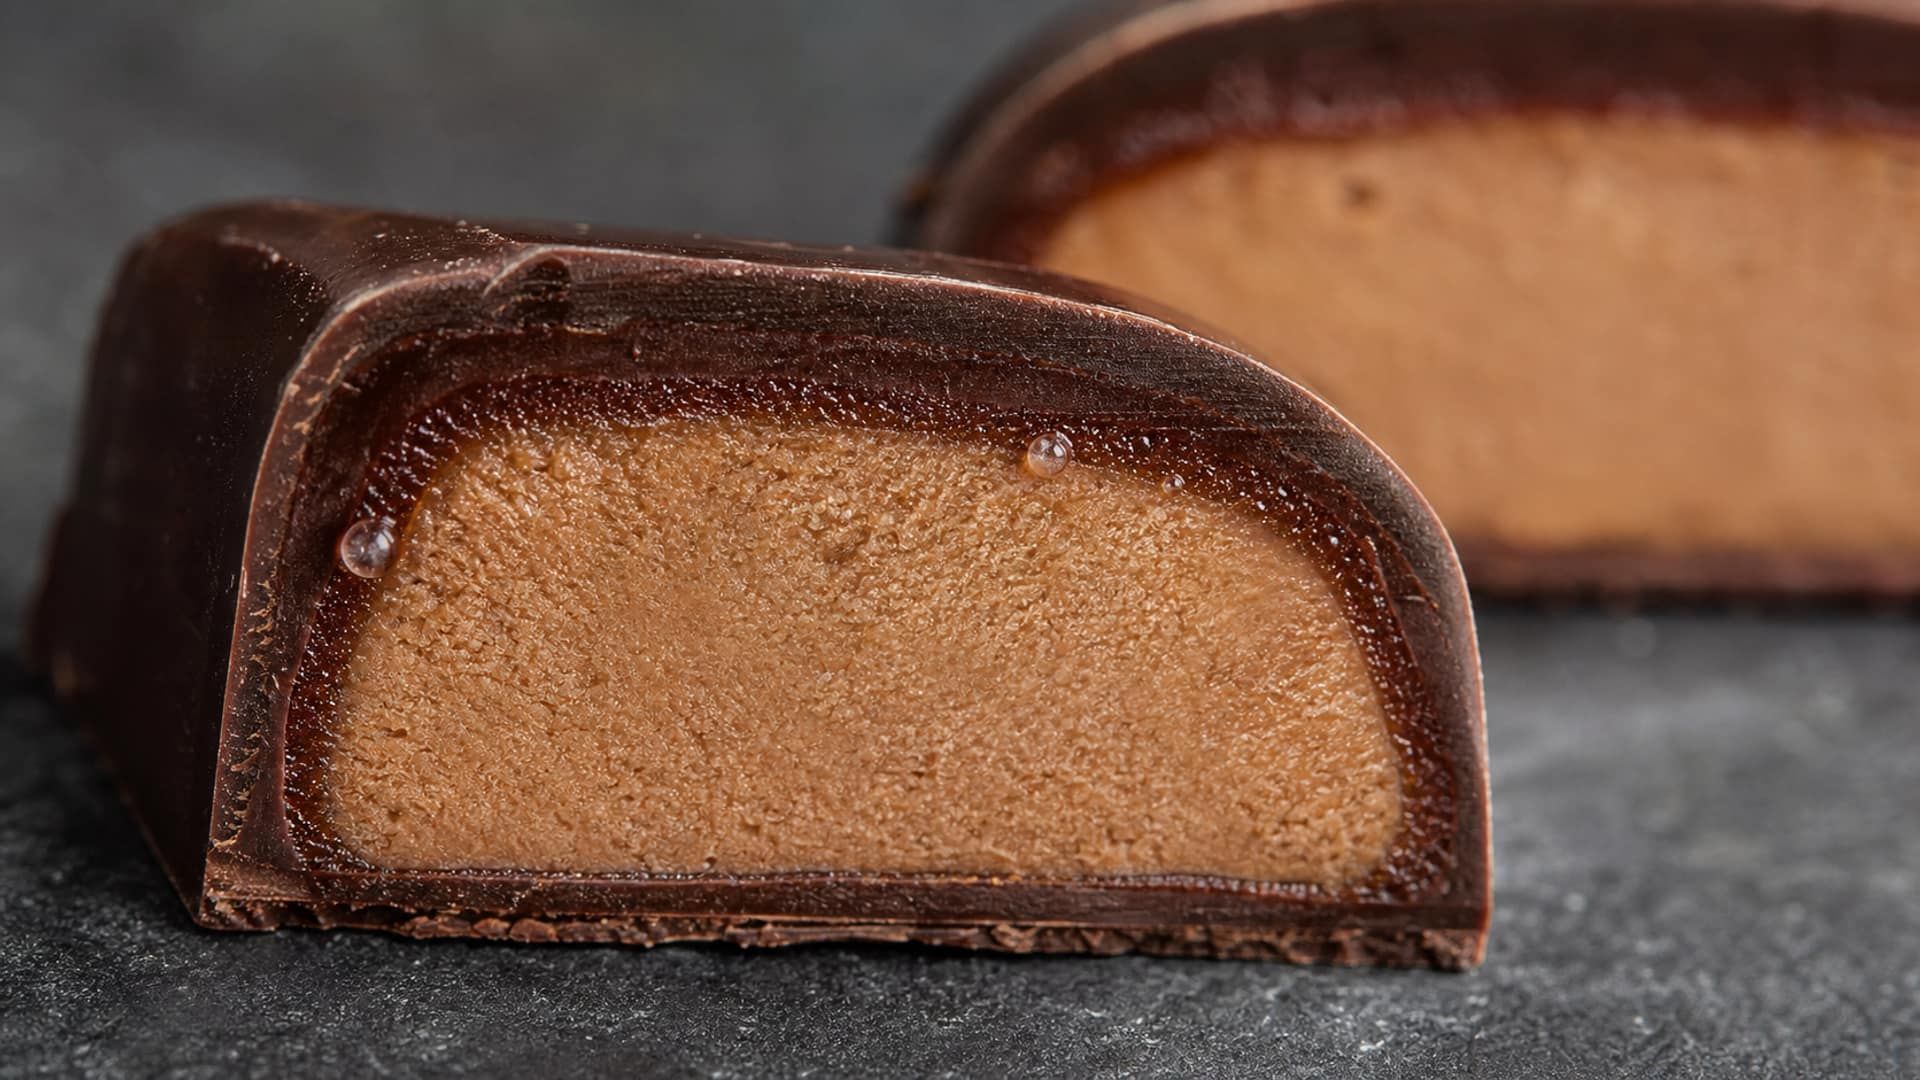
Water activity determines direction; structure determines speed
Water moves within a confection, between its components, and through its package. A crisp inclusion can soften next to a ganache even when the filling contains fewer grams of water per 100 grams than another filling. A caramel can absorb moisture from humid air and become sticky. A pâte de fruit can lose water through a weak wrapper and develop a dry surface.
In a multi-component food, the thermodynamic driving force is a difference in water activity, or more rigorously in water chemical potential. Water tends to move from higher aw to lower aw until equilibrium is approached. It can therefore move against a simple moisture-concentration gradient. Moisture percentage answers “how much water is present”; water activity answers “how strongly the water tends to escape.”
At equilibrium and a fixed temperature, ERH (%) = 100 × aw, where ERH is the equilibrium relative humidity over the product. Temperature matters: measure components at the same controlled temperature before comparing them.
Match activity, not moisture percentage
To screen a layered confection, measure the finished water activity of every component separately. A large activity difference predicts the direction and thermodynamic extent of transfer; it does not by itself predict how fast the defect will appear.
The rate depends on effective diffusivity, distance, interfacial resistance, sorption behavior, temperature, geometry, and packaging. That separation—equilibrium thermodynamics versus transfer kinetics—is the basis of the framework described by Labuza and Hyman for multi-domain foods.
What Fick’s laws describe
Fick’s first law describes steady diffusion caused by a concentration gradient within a defined phase:
J is moisture flux, D_eff is an effective diffusion coefficient, C is concentration in the selected phase, and x is distance. The minus sign indicates flux down that phase's concentration gradient.
In food, D_eff is an effective property rather than the diffusivity of water in a pure liquid. It can incorporate tortuous paths, pores, binding, and matrix mobility. Its value depends on composition, moisture state, temperature, and sometimes concentration. A number taken from a different confection is therefore a starting estimate, not a validated material constant.
For changing concentration with time, Fick’s second law is the governing diffusion equation:
This one-dimensional constant-D form is the simplest case. Boundary conditions, geometry, concentration-dependent diffusivity, and interfacial resistance determine the actual solution.
Crank’s The Mathematics of Diffusion provides general mathematical solutions for slabs, cylinders, spheres, and other boundary conditions that are widely applied to foods. Exact finite-body solutions are generally series, and early uptake in a semi-infinite approximation scales with √t. A single exponential cannot represent every confection and geometry.
A first-order curve can still be useful as a lumped, long-time empirical approximation:
This lumped approximation compresses geometry, diffusion, interfaces, and package effects into a fitted k_lump. Fit the coefficient to measurements from the specific product and package.
Use this curve only when measurements show approximately first-order approach to equilibrium over the relevant interval. Do not use it to infer a diffusion coefficient without a geometry-based model.
WVTR numbers require conditions and units
Water-vapor transmission rate (WVTR) is the mass of water vapor transmitted through a unit area of packaging per unit time under stated test conditions. A complete result looks like g/(m²·day) at 38°C and 90% RH, together with the standard, specimen thickness, and humidity configuration. The units alone are not enough because both temperature and vapor-pressure difference affect the result.
ASTM F1249 measures WVTR through plastic film and sheeting using a modulated infrared sensor. ASTM E96/E96M is a gravimetric water-vapor method used for a broader range of materials. Values from different methods or conditions are not automatically comparable. Report the supplier’s exact method and conditions rather than relabeling every number as a 38°C/90% RH result.
| Required field | Example | Why it matters |
|---|---|---|
| WVTR and units | 2 g/(m²·day) | Converts area into a package-level mass rate only under the test gradient |
| Temperature | 38°C | Permeability commonly rises with temperature |
| Humidity conditions | 90% RH to dry carrier | Defines the vapor-pressure driving force |
| Method | ASTM F1249 | Different instruments and protocols can give non-equivalent results |
| Structure and thickness | 12 μm PET / barrier / PE laminate | Pinholes, seals, folds, and thickness affect the real pack |
Minimum information needed before comparing water-vapor barrier claims.
Package performance also includes seal area, folds, closures, pinholes, product-to-package ratio, and exposed area. A small bonbon and a large slab made from the same film do not gain water at the same rate per gram. Test complete packs when shelf-life evidence matters.
Interpreting packaging scenarios without false precision
If package transmission is the dominant resistance and all other conditions stay constant, time to a given mass transfer may scale approximately inversely with WVTR. Under that narrow assumption, a package rated 2 g/(m²·day) could take about five times as long as one rated 10 g/(m²·day) to reach the same modeled change.
That ratio assumes the same area, product mass, temperature, humidity gradient, sorption response, seals, and failure criterion. It is not a general shelf-life multiplier: change any of those inputs and the result changes. Check the estimate against real packs before using it for labeling or purchasing decisions.
A film datasheet is not a finished-pack shelf-life study
Use WVTR to rank candidates and parameterize a model. Confirm the selected laminate with filled, sealed packs under intended and accelerated conditions, including seal and fold defects representative of production.
No practical flexible package should be described as having “zero WVTR.” High-barrier laminates can reduce transfer substantially, but edges, seals, and handling become increasingly important as film transmission falls. Metallization and foil also require flex-crack and pinhole control.
Multi-component confectionery
Filled chocolate
A ganache commonly has higher aw than a chocolate shell. Water therefore tends to move toward the shell, but the transfer rate through well-tempered chocolate may be slow. The interface can soften, sugar can dissolve locally, and water may interact with other migration processes. Fat bloom should not be presented as a direct consequence of water activity; fat migration and cocoa-butter crystallization have their own mechanisms. Moisture can instead contribute to sugar bloom when condensation or surface wetting is followed by drying.
Control options include lowering the filling’s measured aw without compromising safety or texture, increasing shell thickness, using a validated edible moisture barrier, reducing storage temperature without causing condensation, and shortening the declared life. The barrier’s continuity often matters more than its laboratory permeability.
Crisp inclusions and layered bars
Cereal, wafer, feuilletine, and dehydrated fruit can lose crispness after taking up very little water. Their failure threshold may occur long before components reach equal aw. Coat inclusions continuously with fat or chocolate, minimize exposed edges, and measure texture during storage. A barrier only delays the transfer; a smaller initial aw gap and a shorter diffusion path can still dominate.
Caramel and fruit gels
Many caramels have an equilibrium humidity below a humid room and tend to gain water, producing stickiness and softening. Fruit gels may gain or lose water depending on formulation and environment. Do not assume they always dry. Compare product aw with package headspace and external humidity, then use an appropriate sorption isotherm to translate water gain or loss into texture change.
Building a useful migration study
Measure initial aw and moisture content for each component, because the pair helps define its sorption behavior. Record geometry, layer thickness, contact area, package area, material structure, seals, temperature, and relative humidity. Select a failure marker—crispness, shell firmness, stickiness, mass change, cracking, or visible sugar bloom—and set its acceptance limit before testing.
Sample each domain separately where possible. A whole-product aw can hide a wet center and dry shell that have not equilibrated. Plot mass and aw against time, and use multiple temperatures only if the structure and mechanism remain unchanged. Fit the simplest model supported by data: a lumped exponential for screening or a geometry- and isotherm-based diffusion model for design.
Claims such as “45 days,” “60+ days,” or “five times longer” are valid only as results for named formulations, packages, conditions, and limits. Include uncertainty and verify predicted dates with real-time storage. Packaging changes, new seal equipment, component thickness changes, or ingredient substitutions require reassessment.
References
- Labuza, T. P., and Hyman, C. R. “Moisture Migration and Control in Multi-Domain Foods.” Trends in Food Science & Technology 9(2), 47–55 (1998).
- Crank, J. The Mathematics of Diffusion, 2nd ed. Clarendon Press, 1975.
- Robertson, G. L. Food Packaging: Principles and Practice, 3rd ed. CRC Press, 2012.
- ASTM International. ASTM F1249, Standard Test Method for Water Vapor Transmission Rate Through Plastic Film and Sheeting Using a Modulated Infrared Sensor.
- U.S. Food and Drug Administration. Water Activity (aw) in Foods, Inspection Technical Guide No. 39 (1984).
Frequently Asked Questions
Does water always move from higher moisture content to lower moisture content?
Is the exponential water-activity equation an exact Fick solution?
Can I compare two WVTR values without their test conditions?
Why can a filled chocolate soften in a sealed package?
Related Topics
Related Articles
Why Confectionery Spoils: 4 Aging Mechanisms and How to Manage Them
Every confectionery product starts degrading the moment it's made. The four aging mechanisms behind shelf life, and which formulation levers actually control them.
Q10 and Arrhenius: How Storage Temperature Shortens Shelf Life
Estimate how a change in storage temperature changes confectionery shelf life with the Q10 rule and the Arrhenius equation, work through an accelerated shelf-life test, and learn where both models stop being reliable.
Water Activity in Ganache: The Science Behind Shelf Life Prediction
How the Formul.io Ganache Calculator estimates water activity from a formulation's sugar, polyol, and alcohol composition to predict microbial shelf life — and how to use those numbers responsibly.