Q10 and Arrhenius: How Storage Temperature Shortens Shelf Life
Estimate how a change in storage temperature changes confectionery shelf life with the Q10 rule and the Arrhenius equation, work through an accelerated shelf-life test, and learn where both models stop being reliable.
Why Temperature Changes the Date
The short version
Most quality loss in confectionery is chemistry or biology, and both run faster when the product is warmer. The Q10 rule and the Arrhenius equation turn that into numbers: if you know how fast a product fails at one temperature, you can estimate how fast it fails at another. The estimate is only as good as the assumption that the same failure mode limits shelf life at both temperatures.
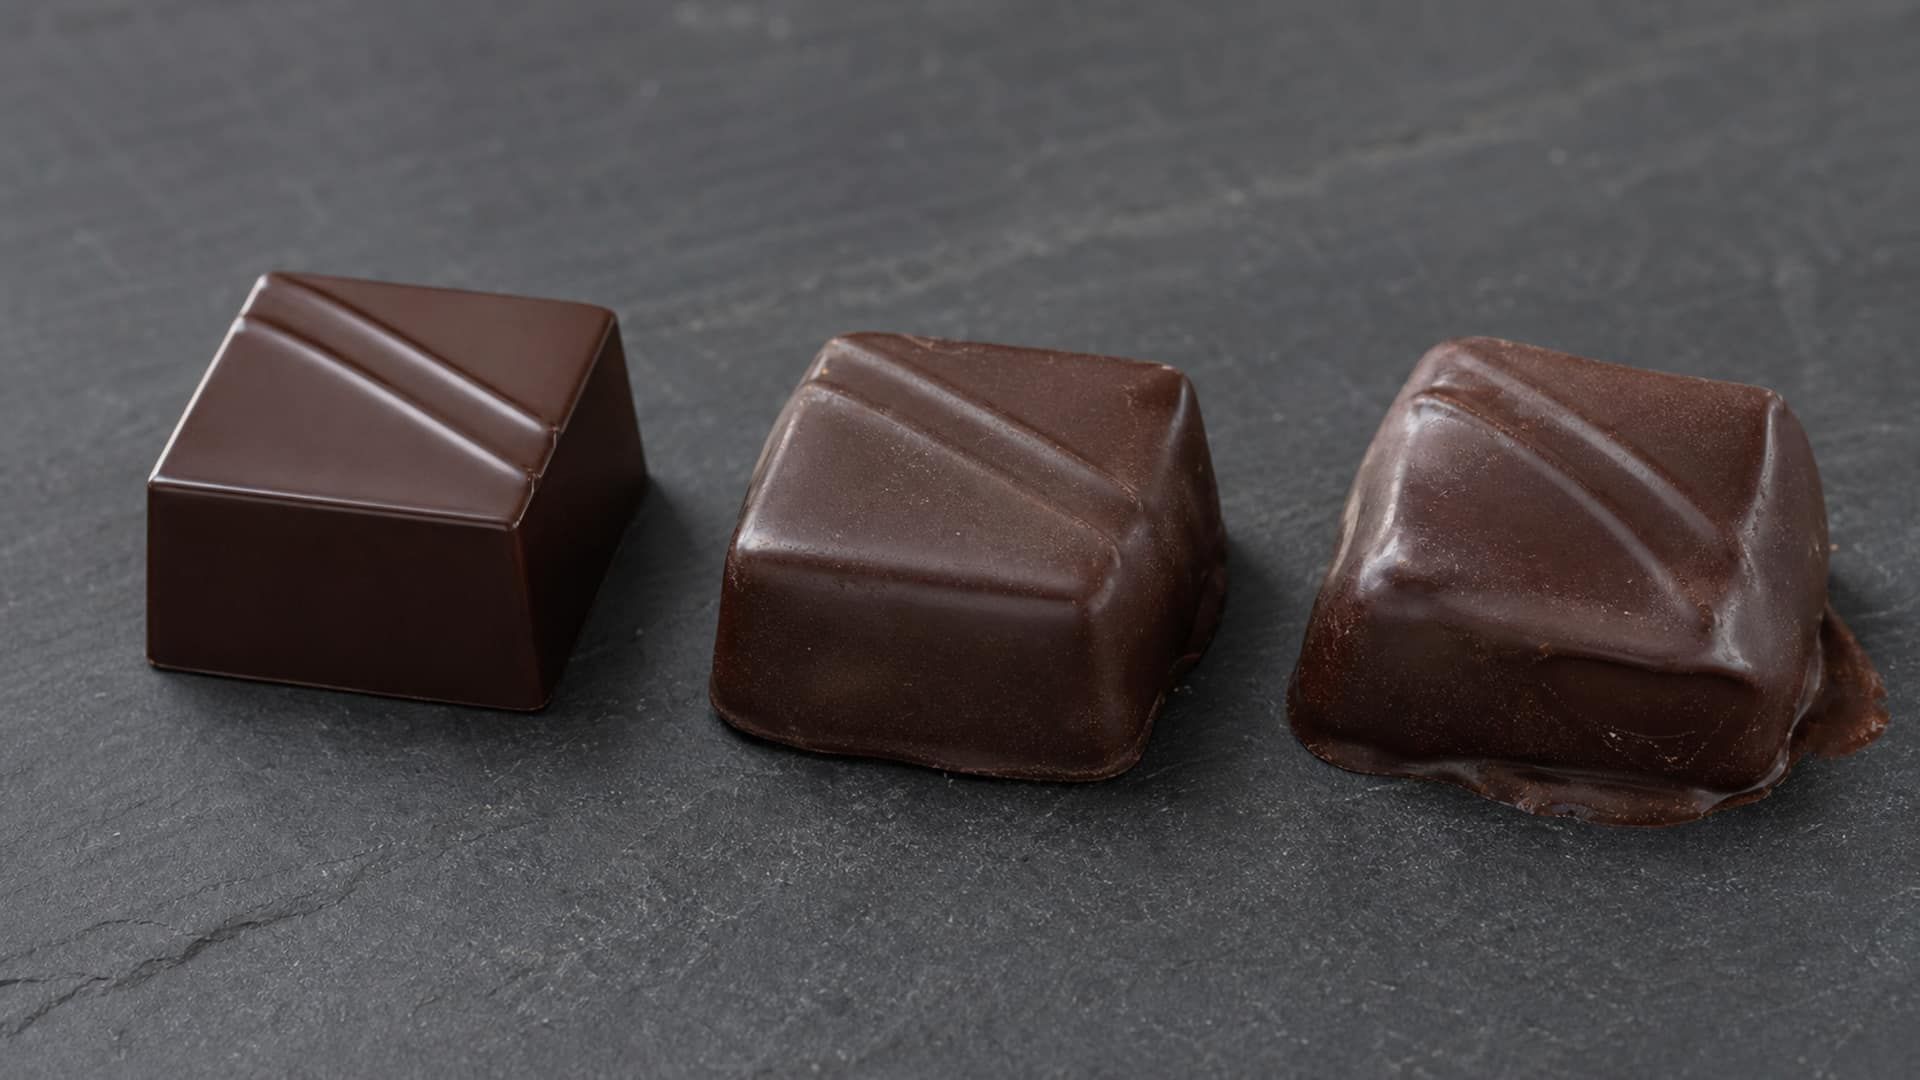
A box of bonbons that keeps for six weeks in a cool shop can fail in three in a warm delivery van. Nothing in the recipe changed; the rate of the reaction that ends its life did. That rate is what the models below describe.
Shelf life is the time until the limiting failure reaches your acceptance limit: rancid flavour, visible mould, a dried-out centre, grain in a fondant. Each of those has its own temperature sensitivity, so every calculation on this page starts with the same question: which failure ends this product’s life? Why confectionery spoils covers the four mechanisms; this page covers how temperature scales them.
The Arrhenius Equation
In 1889 Svante Arrhenius described how the rate constant of a chemical reaction depends on absolute temperature. The equation is still the basis of shelf-life kinetics in food science; Labuza’s review “Application of chemical kinetics to deterioration of foods” (Journal of Chemical Education, 1984, 61(4): 348–358) is the classic account of how to apply it to foods.
k is the rate constant of the reaction that limits shelf life, A is a pre-exponential factor, Ea is the activation energy in J/mol, R is the gas constant (8.314 J/mol·K) and T is the absolute temperature in kelvin (°C + 273.15). Activation energies are usually quoted in kJ/mol; multiply by 1000 before using them here.
You never need A in practice. Shelf life is inversely proportional to the rate constant, so what matters is the ratio of rates at two temperatures, and A cancels out:
T₁ and T₂ are in kelvin. Measure the time to failure at two temperatures and this equation gives Ea; know Ea and one shelf life, and it gives the shelf life at any other temperature in the same failure regime.
The activation energy is the number that sets temperature sensitivity. A reaction with a high Ea speeds up sharply when the product warms; a reaction with a low Ea barely notices. The table converts Ea into the more intuitive Q10 for the 20 → 30 °C step, using ln Q10 = 10 × Ea / (R × T₁ × T₂).
| Activation energy (kJ/mol) | Q10 between 20 and 30 °C | What it means |
|---|---|---|
| 12 | 1.18 | Rate rises by under a fifth per 10 °C |
| 40 | 1.72 | Rate rises by about three-quarters |
| 50 | 1.97 | Rate roughly doubles |
| 60 | 2.25 | Rate more than doubles |
| 80 | 2.95 | Rate roughly triples |
| 100 | 3.87 | Rate nearly quadruples |
Q10 calculated from activation energy for the 20 → 30 °C interval. The same Ea gives a slightly smaller Q10 at higher temperatures.
The Q10 Model
Q10 is the factor by which a rate rises for every 10 °C of warming. It is a simplification of Arrhenius that works well over the narrow temperature span of real storage, and it is easier to reason with on a production floor.
With Q10 = 2, warming a product from 20 °C to 30 °C halves its shelf life, and cooling it from 20 °C to 10 °C doubles it. A 5 °C change shifts shelf life by √2 ≈ 1.41.
Packaging and stability guidance commonly uses Q10 = 2 as a default when nothing has been measured. Treat that as a starting assumption for planning, not as a property of your product.
Worked example: one product, three storage temperatures
Suppose a filled product reaches its acceptance limit after 30 days at 18 °C, and its limiting reaction has Q10 = 2.5. At 28 °C the estimate is 30 ÷ 2.5 = 12 days. At 8 °C it is 30 × 2.5 = 75 days, provided the same reaction still limits shelf life in the cold and the product does not suffer condensation or texture damage on the way in and out of the fridge.
One caveat keeps the model honest: Q10 is not a single universal number. It depends on which reaction limits shelf life, and the dominant mechanism can switch as temperature changes. A product that spoils microbially at room temperature may instead go slowly rancid in the cold, which is why refrigeration helps some products far more than others. Use a Q10 or Arrhenius projection to rank storage scenarios and set a first estimate, then confirm the date with a real-time trial at the temperature the product will actually see. The shelf-life testing guide shows how to plan that trial.
Rule of thumb
Pick the Q10 of the mechanism that actually limits your product, not a blanket value, and validate it against stored samples. If you have measured nothing, Q10 = 2 is a planning assumption, not a result.
Typical Q10 by Failure Mode
The same box can contain several clocks running at different speeds. The table summarises how each failure mode responds to temperature and what to do with that.
| Failure mode | Temperature response | How to use Q10 |
|---|---|---|
| Fat oxidation (rancidity) | Follows Arrhenius over normal storage temperatures; measured Q10 varies widely between products | Measure it. A chocolate spread's peroxide value rose with Q10 of only about 1.2 between 15 and 50 °C |
| Non-enzymatic browning | Usually more temperature-sensitive than lipid oxidation | Expect a higher Q10 than for rancidity; relevant to milk crumb, caramel and dulce-type fillings |
| Microbial growth | Q10 is not constant: it is largest in the cold and shrinks as temperature approaches the organism's optimum | Do not extrapolate across a wide range with one value; use challenge or storage studies |
| Moisture migration | Driven by diffusion and by the humidity difference across the pack | Temperature matters, but packaging and humidity usually matter more |
| Sugar crystallisation | Does not follow simple Arrhenius behaviour | Control supersaturation and temperature cycling instead of extrapolating |
How the main confectionery failure modes respond to storage temperature
Microbial Growth
Microbial growth rate rises with temperature up to the organism’s optimum and then falls steeply, so a single Q10 cannot describe it. Below the optimum, Ratkowsky and co-workers (Journal of Bacteriology, 1982, 149(1): 1–5) showed that the square root of the growth rate rises linearly with temperature above a theoretical minimum, T_min.
That relationship means Q10 shrinks as the product warms. For an illustrative organism with T_min = −5 °C, warming from 5 to 15 °C multiplies the growth rate by 4.0, from 15 to 25 °C by 2.25, and from 25 to 35 °C by about 1.8, as long as 35 °C is still below its optimum. A rate measured in the warm therefore understates how much refrigeration slows growth, and a rate measured in the cold overstates how much warmth speeds it up.
For safety-relevant products, water activity and pH decide whether organisms can grow at all; temperature decides how fast. A Q10 estimate is never a substitute for the safety assessment of a high-aw product.
Fat Oxidation
Oxidation of cocoa butter, dairy fat and nut oils produces the stale, painty or cardboard notes that end the life of many low-aw confections. It is the textbook case for Arrhenius extrapolation, yet measured temperature sensitivity varies a lot. Tolve and co-workers stored chocolate spreads at 15, 30, 40 and 50 °C and found activation energies of about 11–15 kJ/mol for peroxide formation, which corresponds to a Q10 of only about 1.15–1.20 (Foods, 2022, 11(15): 2358).
Assuming Q10 = 2 for such a product would badly overstate how much a cool store extends its life. Antioxidants also change the picture: Ragnarsson and Labuza (Food Chemistry, 1977, 2(4): 291–308) pointed out that accelerated rancidity tests assume the same activation energy with and without antioxidants, when it can be considerably higher with them present.
Sugar Crystallisation
Crystallisation is a poor fit for Arrhenius. Warming increases molecular mobility, which speeds crystal growth, but it also increases sugar solubility, which reduces the supersaturation that drives crystallisation. The two effects pull in opposite directions, so there is no single activation energy to extrapolate with.
What reliably makes crystallisation worse is temperature cycling: each warm period dissolves the smallest crystals and each cool period deposits sugar onto the survivors, which grow into grit. The same cycling drives fat bloom in chocolate; see chocolate blooming risks for the cocoa butter side. For both, stable storage matters as much as the average temperature.
Worked Example: An Accelerated Shelf-Life Test
Accelerated shelf-life testing (ASLT) stores the product warmer than normal so the limiting failure appears sooner, then uses Arrhenius or Q10 to translate the result back to normal storage. The numbers below are illustrative, for a low-aw nut-caramel bar packed in a barrier film whose shelf life ends with a rancid note.
Choose the failure and the limit
Define the end point before storing anything, for example 'a trained panel detects a rancid note in two of three samples'. Use the same end point at every temperature.
Store at two or more raised temperatures
Here, packs are held at 30 °C and 40 °C. Three temperatures are better than two, because they show whether the rate falls on a straight line when plotted as ln(rate) against 1/T.
Record the time to failure
In this example the limit is reached at day 30 at 40 °C and at day 60 at 30 °C. The measured Q10 between the two is 60 ÷ 30 = 2.0.
Calculate the activation energy
Ea = R × ln(k₄₀ / k₃₀) ÷ (1/303.15 − 1/313.15) = 8.314 × ln 2 ÷ 0.0001054 ≈ 54.7 kJ/mol.
Extrapolate to the storage temperature
From 30 °C to 20 °C, Arrhenius gives a rate ratio of exp[(54,700 ÷ 8.314) × (1/293.15 − 1/303.15)] ≈ 2.10, so the estimate is 60 × 2.10 ≈ 126 days. Using the constant Q10 of 2.0 gives 60 × 2.0 = 120 days.
Confirm in real time
Keep packs at 20 °C and test them against the same end point. The accelerated result tells you which week to watch; the real-time result sets the date.
The two estimates differ by six days because Q10 itself falls slightly as temperature rises; Arrhenius accounts for that and a constant Q10 does not. Over a 10–20 °C extrapolation the difference is small. Over a 30 °C extrapolation it grows, and so does the uncertainty from measuring only two points.
When an accelerated test misleads
Raised temperature only helps if it speeds up the same failure. Campden BRI notes that changing the storage temperature can alter which groups of microorganisms grow, and advises that accelerated testing should not be used to determine the microbiologically safe shelf life of perishable foods with a “use by” date. For chocolate products the limit is physical: Form V cocoa butter melts at about 33.8 °C and softens well below that, so a 40 °C test measures melting and bloom, not normal ageing. Keep accelerated temperatures for chocolate-containing products below the point where the shell softens, and never use ASLT to set the microbiological shelf life of a high-aw filling.
Using Temperature in the Aging Forecast
The Aging Forecast in Formul.io applies the same logic to your own formula. Open it from the calculator’s actions menu or the Aging tab of a saved recipe, then set storage temperature, relative humidity, packaging quality and light exposure. Three presets cover the usual cases: Room Temperature (20 °C, 60% RH), Refrigerated (4 °C, 85% RH) and Warm Climate (28 °C, 70% RH, high light). Most calculators accept 0–35 °C; mousse is limited to 0–25 °C, and ice cream runs from −25 to 10 °C with a Frozen preset.
The forecast uses Q10 = 2.0 for chemical ageing and Q10 = 2.5 for microbial growth, and caps the microbial speed-up at the warm end, where growth stops following Q10. Moisture exchange through the pack doubles for every 15 °C of warming. For products above 25% fat stored above 22 °C, it also flags a fat-bloom risk after the first week.
Run the planned condition
Calculate the formula and run the forecast at the temperature where the product will spend most of its life, for example the Room Temperature preset.
Compare a refrigerated scenario
Switch to the Refrigerated preset and run it again. If the date barely moves, the limiting failure is not temperature-driven and cold storage will not buy you much.
Test the worst case
Switch to Warm Climate, or set the highest temperature the product will meet in transport or display. This is the margin you are relying on.
Decide the route
Use the comparison to decide whether the product needs a cooler route, a reformulation to lower water activity, a better pack, or simply a shorter date in summer.
Treat the forecast as a ranking
The forecast uses default Q10 values, not values measured on your product. Use it to compare formulas and storage routes against each other, then confirm the winning option with a storage study before printing a date.
Frequently Asked Questions
How do I calculate shelf life at a different temperature with Q10?
What is the difference between Q10 and the Arrhenius equation?
Why do some products age faster in the fridge than at room temperature?
Is freezing always better for shelf life?
How do I account for temperature variation during shipping?
How many temperatures do I need for an accelerated shelf-life test?
Related Topics
Related Articles
Confectionery Shelf-Life Testing: Plan Your First Study
Build a retention-sample plan for a filled chocolate: choose checkpoints, calculate the packs needed, and record results without confusing a trial target with a validated date.
Why Confectionery Spoils: 4 Aging Mechanisms and How to Manage Them
Every confectionery product starts degrading the moment it's made. The four aging mechanisms behind shelf life, and which formulation levers actually control them.
Moisture Migration: Water Activity, Fick's Law, and Packaging
Predict moisture movement by separating its water-activity driving force from diffusion rate, and compare packaging only with WVTR units and test conditions attached.