Ingredient Substitution Science: Match Function, Not Weight
A practical, evidence-based method for replacing fats, sugars, and dairy ingredients without inventing precision that the formulation cannot support.
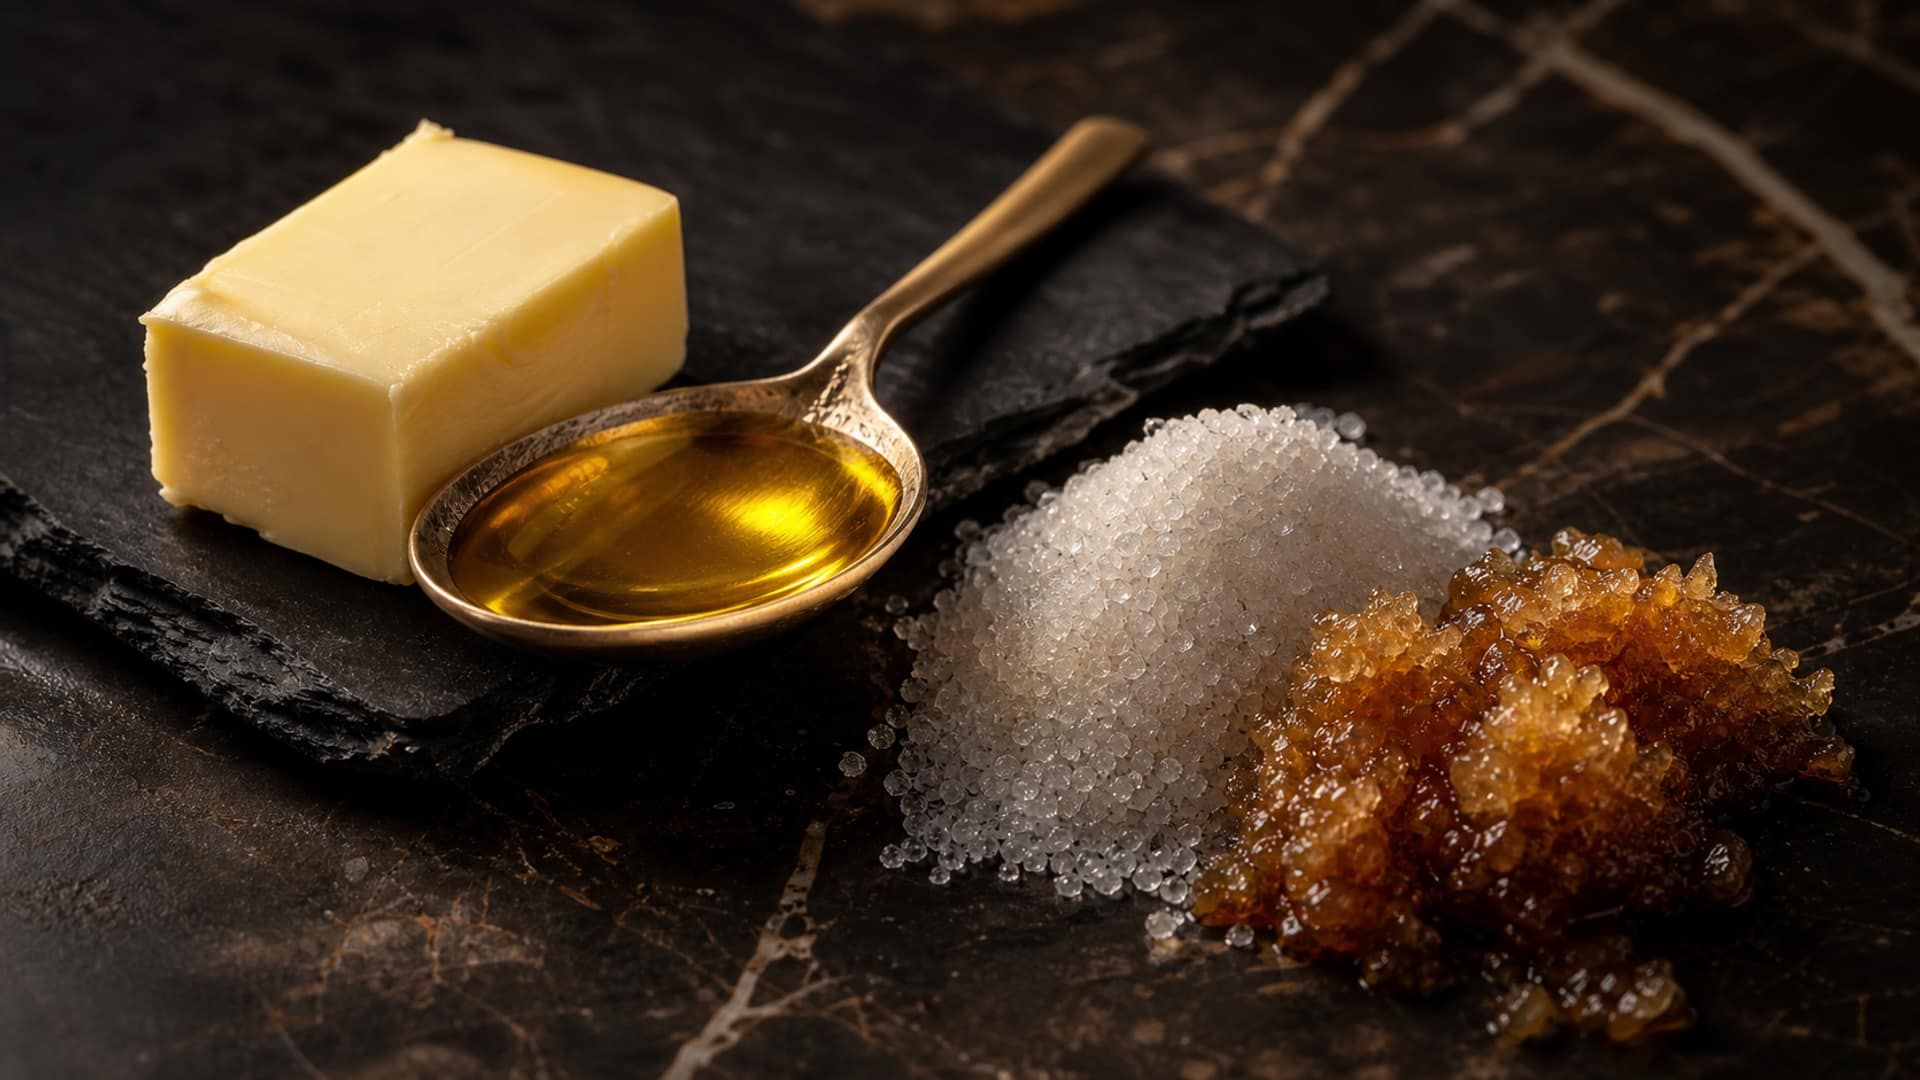
Replacing an ingredient by equal weight is rarely a neutral operation. Cream is not simply “35% fat,” butter is not simply “solid fat,” and sucrose is not simply sweetness. Each ingredient contributes water, dissolved solids, crystal behavior, flavor, interfacial activity, and process tolerance. A useful substitution therefore begins with a mass balance and ends with measurements on the finished product.
The governing rule
Match the functions that matter in the specific product, not the ingredient name or package weight. Treat calculated values as screening estimates. Confirm water activity with a calibrated meter, texture with a repeatable test, and shelf life with a product-specific validation program.
Start with functional equivalence
“Equivalent” depends on the product. A softer fat may be acceptable in a piped ganache but disastrous in a snapped chocolate shell. Extra water may improve processing yet raise microbial and migration risk. A low-sweetness sugar may preserve solids but alter freezing behavior or glass transition. Define the required output before choosing the replacement.
For most confectionery substitutions, record at least five properties for the original ingredient and candidate:
| Property | Why it matters | How to verify |
|---|---|---|
| Water and dissolved solids | Changes phase ratio, concentration, water activity, and process yield | Supplier specification, mass balance, refractometry where applicable |
| Fat content and solid-fat profile | Controls firmness, melt, coating set, and oil migration | Supplier SFC curve, DSC, or controlled texture tests |
| Sweetness and freezing-point effect | Changes flavor and frozen-product softness independently | One declared coefficient system plus sensory and freezing tests |
| Emulsion function | Affects droplet formation and resistance to coalescence | Process trial, microscopy or separation test |
| Crystallization and compatibility | Controls snap, graining, temper, and bloom | Temper test, storage trial, DSC or X-ray analysis |
A substitution is functionally equivalent only for the properties relevant to the product.
Do not collapse these properties into one score. Two formulas can have the same total fat and very different solid-fat content at 20°C. They can have the same total water and different aw because solute identity and concentration differ. They can also have similar predicted aw but different microbiological stability because pH, hygiene, preservatives, packaging, and storage differ.
Use supplier certificates for the actual materials. “Coconut cream,” “oat cream,” glucose syrup, and plant butter are categories, not fixed compositions. Their water, fat, protein, solids, and stabilizer contents can vary enough to reverse a calculation.
Replacing fats: composition and phase behavior
Butter illustrates why label shorthand is risky. USDA reference data for unsalted butter is approximately 81% fat, 16% water, and 0.85% protein per 100 g; the remaining fraction is mostly other milk solids. Protein is part of the total milk solids-non-fat fraction, so it should not be counted again as a separate additive fraction.
Replacing 100 g butter with 100 g anhydrous fat removes roughly 16 g water and almost all milk protein. Adding back 16 g water restores the water mass but produces 116 g of replacement mixture, not 100 g. A weight-preserving reconstruction instead solves simultaneous mass balances for fat and water. It may also need an emulsifier or protein, but no universal lecithin equation can derive that dose from the protein ratio alone.
This is a composition identity, not a texture model. After matching the fat fraction, compare the solid-fat profile at storage, handling, and oral temperatures.
Solid-fat content (SFC) must be treated as a curve, not a single canonical number. Milk fat varies with season, origin, and thermal history; fractionated vegetable fats vary by specification. Values quoted at 4°C or 20°C are therefore approximate ranges. Ask the supplier for an SFC curve measured by an identified method, then test the finished matrix because dissolved and dispersed ingredients can shift crystallization.
Cocoa butter is a special case
Cocoa butter obtains gloss and snap from a controlled polymorphic network. Lauric fats such as coconut and palm-kernel oils have very different triacylglycerol compositions. Mixing them into real chocolate can produce eutectic softening and bloom instead of behaving as a simple lower-melting cocoa butter. Cocoa-butter equivalents are designed around closer triacylglycerol compatibility; ordinary coconut oil is not a cocoa-butter equivalent.
This does not mean coconut oil is unusable in every confection. It can work in an untempered ganache or a deliberately formulated compound coating. It does mean the product must no longer be reasoned about as unchanged tempered chocolate. Check local standards before naming a coating “chocolate.”
Do not validate compatibility by melting point alone
Matching one melting point does not reproduce cocoa butter polymorphism. For a tempered shell, use chocolate, cocoa butter, or a documented compatible fat system and verify temper and bloom resistance under the intended storage cycle.
Replacing cream: do the arithmetic before emulsifying
Suppose a coconut cream contains 22–24 g fat per 100 g and the target is a mixture that is genuinely 35% fat by total mass. If x grams of pure cocoa butter are added, the balance is (initial fat + x) / (100 + x) = 0.35. The required addition is about 20 g at 22% starting fat and 17 g at 24% starting fat.
An addition chosen only to bring the absolute fat mass to 35 g per original 100 g of cream does not make the resulting mixture 35% fat, because the added cocoa butter also increases total mass. Solve against the new denominator as shown below.
Worked composition example
For coconut cream at 23% fat, solve (23 + x)/(100 + x) = 0.35. The result is x = 18.46 g. The new mixture contains 41.46 g fat in 118.46 g total, or 35.0%. If the original cream supplied 72 g water, the reconstructed mixture contains about 60.8% water—close to, but not automatically identical with, a particular dairy cream.
Matching fat and water still does not recreate dairy cream. Dairy proteins adsorb at oil–water interfaces; coconut proteins and added hydrocolloids behave differently. Lecithin can help, but the useful dose depends on chocolate composition, total dispersed surface, mixing energy, temperature, and other emulsifiers. A starting trial range such as 0.2–0.5% of the finished formula must be refined for the complete formulation. Run a dose series and watch for both separation and excessive viscosity.
The safest workflow is to calculate several candidate formulas, emulsify them with the same temperature and shear history, and compare immediate appearance, cooling curve, firmness after equilibration, and separation after a defined accelerated cycle. Document the brand and lot of plant cream because a supplier reformulation can change the result.
Replacing sugars: keep sweetness, colligative effects, and aw separate
Sucrose, glucose, fructose, invert sugar, trehalose, and glucose syrups cannot be exchanged through one “sweetness percentage.” Three different questions must be answered:
- How sweet is the ingredient under the product’s temperature, concentration, and flavor conditions?
- How many dissolved particles does it contribute, affecting freezing-point depression and water activity?
- How does it affect crystallization, glass transition, hygroscopicity, and browning?
Glucose and fructose have the same molar mass, about 180.16 g/mol. On an ideal molar basis they therefore contribute essentially the same freezing-point depression per gram. Their perceived sweetness differs, and reported POD values vary with method and temperature. Sucrose has a molar mass of about 342.30 g/mol, so a gram of a monosaccharide contributes roughly 1.9 times as many moles as a gram of sucrose. Real concentrated foods are non-ideal, so that ratio explains direction rather than guaranteeing a finished-product coefficient.
Invert sugar is a mixture produced by hydrolyzing sucrose into glucose and fructose. Its relative sweetness should come from a measured reference for a declared composition, commonly around 1.2–1.3 times sucrose in confectionery tables, not from simply averaging two isolated POD numbers. Commercial invert syrups also contain water and may retain sucrose, so use dry solids—not syrup weight—when balancing a formula.
Glucose syrup is a distribution of saccharides rather than pure glucose. Dextrose equivalent describes reducing power relative to dextrose on a dry basis; it does not uniquely determine sweetness, molecular-weight distribution, or viscosity. Use the supplier’s dry-solids percentage and carbohydrate profile. A 50 g addition of 80%-solids syrup contributes 40 g solids and 10 g water; a different syrup specification changes both values.
| Change | Expected direction | Required check |
|---|---|---|
| Sucrose → dextrose on equal dry mass | Lower sweetness; greater molar freezing-point effect; more reducing sugar | Sensory balance, frozen fraction, browning, hygroscopicity |
| Sucrose → invert syrup | Usually greater sweetness and hygroscopicity; syrup adds water | Declared solids and inversion, aw measurement, stickiness |
| Sucrose → trehalose | Lower sweetness with similar disaccharide molar mass; no reducing end | Tg, hydration state, crystallization, cost |
| One glucose syrup → another DE/profile | Viscosity, sweetness, and crystallization control may all move | Supplier saccharide profile and pilot cook |
Directional effects are more portable than one universal POD/PAC table.
Water activity: predict cautiously, measure decisively
Water activity is the equilibrium vapor-pressure ratio aw = p/p₀, also equal to equilibrium relative humidity divided by 100 at the same temperature. It is not the same as moisture content. FDA guidance emphasizes temperature-controlled measurement because even a small temperature difference between sample and sensor can materially change the result.
The Norrish relationship models activity coefficients in confectionery syrups using mole fractions and solute-specific constants. Applying a sucrose-solution constant to a ganache containing proteins, particles, mixed sugars, salts, and polyols is an extrapolation, so a syrup model should not be used by itself to assign a shelf-life date to ganache.
Use predictions to compare, not certify
Calculated water activity can help rank formulation variants, but it does not replace measurement with a calibrated meter or establish microbiological shelf life. Even the same 0.03 change in aw can have different consequences depending on pH, contamination, preservatives, package, and storage temperature.
For a substitution trial, measure aw after the product has equilibrated and repeat at the intended storage temperature. Use replicate units from separate production runs. Then design microbial and sensory validation around the product’s pH, preservatives, hygiene, oxygen exposure, packaging, and distribution temperature. A day count derived only from aw is not a guarantee.
A controlled substitution workflow
Use this sequence to avoid false precision:
- Lock the target. Define total yield, water, fat, sweetness, handling temperature, target texture, allergen constraints, and legal product identity.
- Collect specifications. Record each ingredient’s moisture, dry solids, fat, protein, sugar profile, and relevant SFC or melting data.
- Close the mass balance. Recalculate totals after every addition; percentages use the new total mass.
- Separate models by purpose. Use molar calculations for direction, SFC for fat state, and supplier data for commercial mixtures. Keep every fitted shortcut within the formulation and operating range used to derive it.
- Run a small designed trial. Change one compensating variable at a time or use a documented mixture design.
- Measure the product. Confirm
aw, pH where relevant, texture, temper, yield, and sensory quality. - Validate storage. Test the real packaging and temperature cycle. Include microbiological review whenever shelf life or safety is affected.
This workflow does not promise that the first trial will succeed. It makes each result interpretable and separates measured evidence from the precision of a calculation.
Frequently asked questions
References
- U.S. Food and Drug Administration. Water Activity (aw) in Foods. Inspection Technical Guide No. 39.
- Norrish, R. S. (1966). An equation for the activity coefficients and equilibrium relative humidities of water in confectionery syrups. Journal of Food Technology, 1, 25–39.
- U.S. Department of Agriculture, Agricultural Research Service. FoodData Central: Butter, without salt (FDC 173430).
- Institute of Food Science & Technology. Sugars: information statement.
- Goff, H. D., & Hartel, R. W. (2013). Ice Cream, 7th ed.. Springer.
- Lonchampt, P., & Hartel, R. W. (2004). Fat bloom in chocolate and compound coatings. European Journal of Lipid Science and Technology, 106(4), 241–274.
Related Topics
Related Articles
Water Activity in Ganache: The Science Behind Shelf Life Prediction
How the Formul.io Ganache Calculator estimates water activity from a formulation's sugar, polyol, and alcohol composition to predict microbial shelf life — and how to use those numbers responsibly.
POD and PAC in Ice Cream: A Practical Science Guide
Learn what POD and PAC indices can—and cannot—tell you about sweetness, freezing-point depression, scoopability, and sugar selection in frozen desserts.
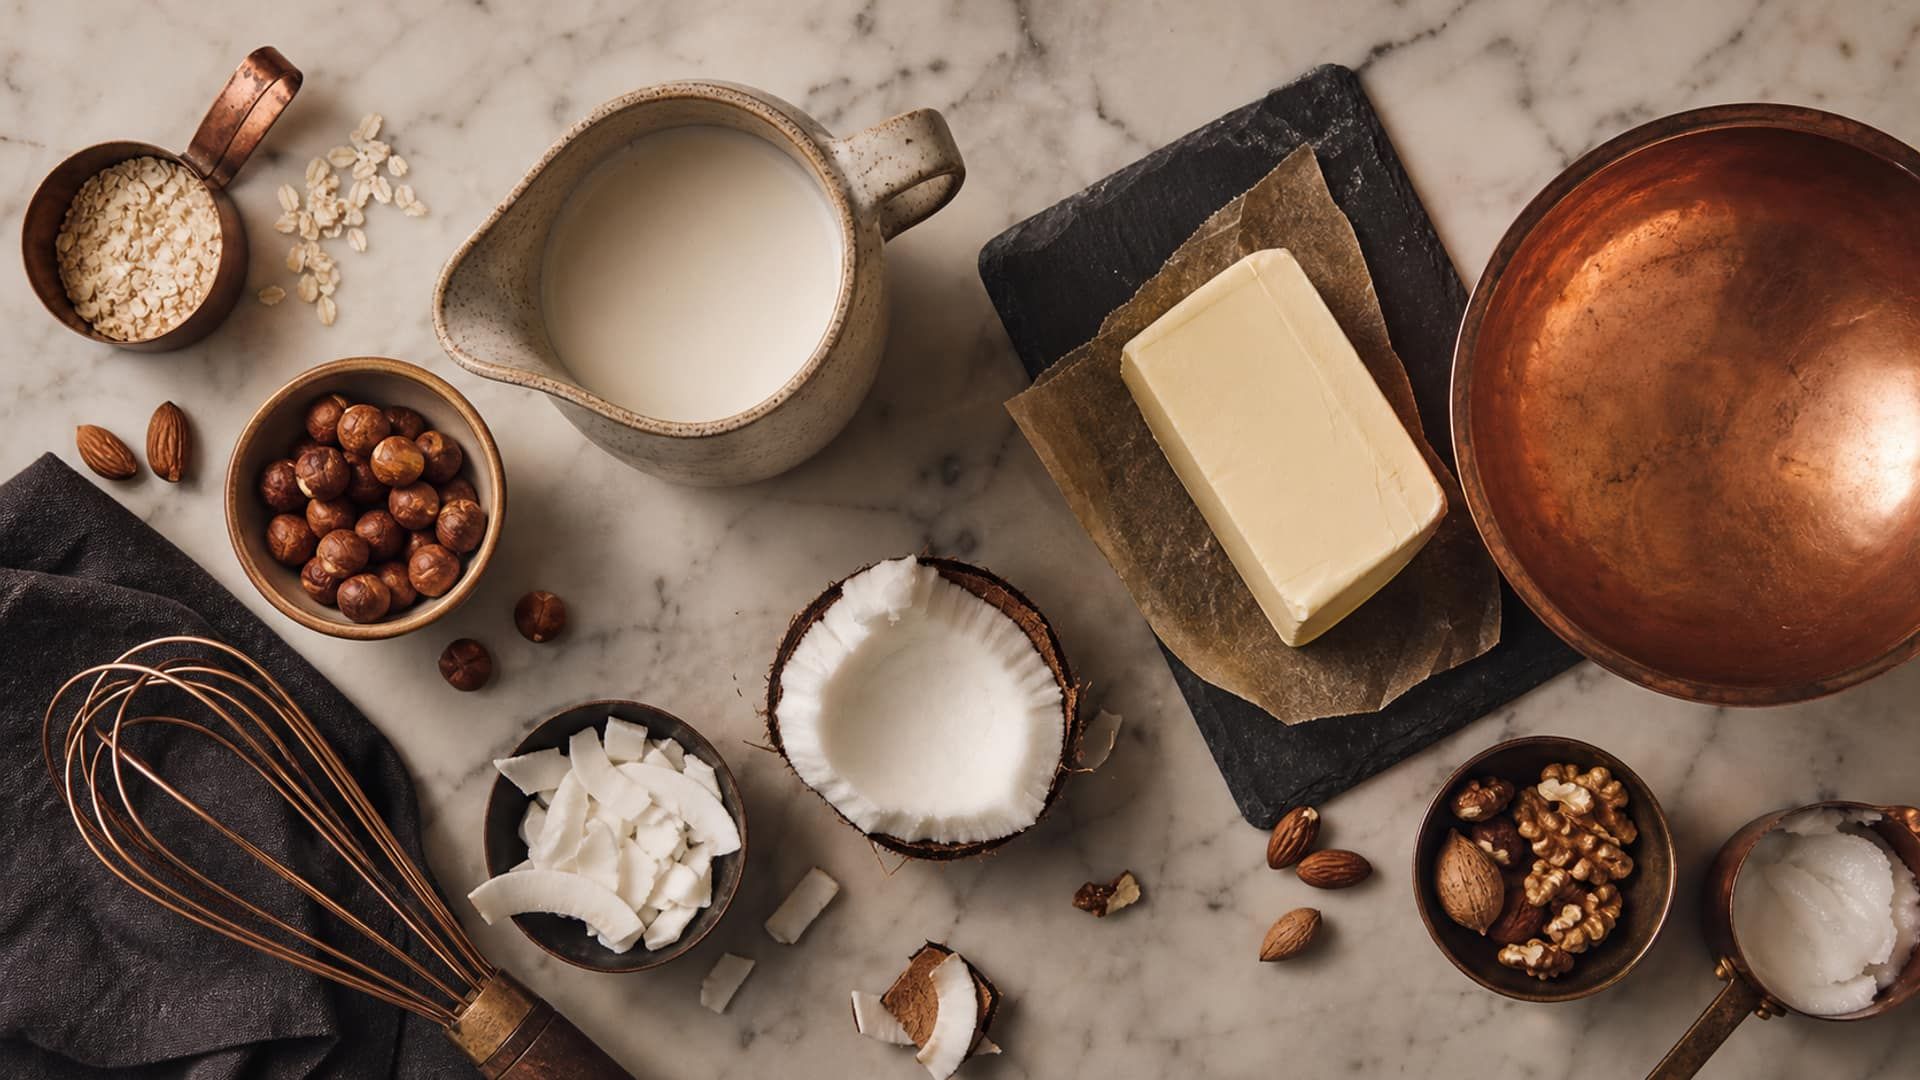
Plant-Based Dairy Substitution: Milk, Cream, and Butter in Pastry
Replace dairy in pastry by function, not by name — match the fat, water, protein, and aeration each ingredient delivered, then compensate the gaps with the right plant alternative and emulsifier.