Fior di Latte Gelato: 1 kg PAC Sugar-Balancing Example
Work through a 1 kg fior di latte base to balance PAC, sweetness, solids, serving temperature, and production validation.
PAC (potere anti-congelante, anti-freezing power) helps you compare how strongly a gelato sugar system depresses freezing relative to sucrose. It does not tell you the right serving temperature, sweetness, solids, or texture by itself; those targets must be designed together.
Start with the cabinet, not a universal PAC
Define the product style, serving temperature, storage temperature, overrun, and desired sweetness first. Then use PAC to build a sugar blend for that operating window and validate it in the real freezer.
Set the Gelato and Serving Target First
Gelato is a partly frozen foam: ice crystals and air cells sit in a freeze-concentrated serum of water, sugars, milk solids, minerals, and stabilizers. PAC describes the relative anti-freezing contribution of dissolved components, while POD (potere dolcificante, sweetening power) describes relative sweetness; total solids, fat, milk-solids-not-fat (MSNF), overrun, and process determine the rest of the eating structure.
A higher PAC usually leaves more water unfrozen at a given temperature and makes the product easier to scoop. That does not mean “higher is better.” Too much freezing-point depression can make the gelato weak or slushy, while too little can make it hard even when the flavour and solids are otherwise correct.
Choose the real use case before adjusting sugar:
- Serving target: the product temperature when the operator portions it, not the air set point printed on the cabinet.
- Storage target: the coldest and warmest conditions the product will experience before service.
- Overrun: air changes apparent density, thermal sensation, and resistance to scooping.
- Sweetness style: fior di latte, cocoa, nuts, and acidic fruit do not present the same sweetness at one POD.
- Solids window: sugar replacement must preserve body as well as freezing behaviour.
A Worked Fior di Latte PAC Example
The baseline and two saved variants were recalculated in Formul.io on 1 October 2026. Ingredient-card composition is part of this example: dextrose contains 5% water, and the undiluted E471 reference is modelled as 100% fat without a cellulose carrier. These are calculation inputs, not production measurements; use a food-grade emulsifier intended for ice cream and check its supplier specification and instructions.
| Ingredient | Quantity | Primary role |
|---|---|---|
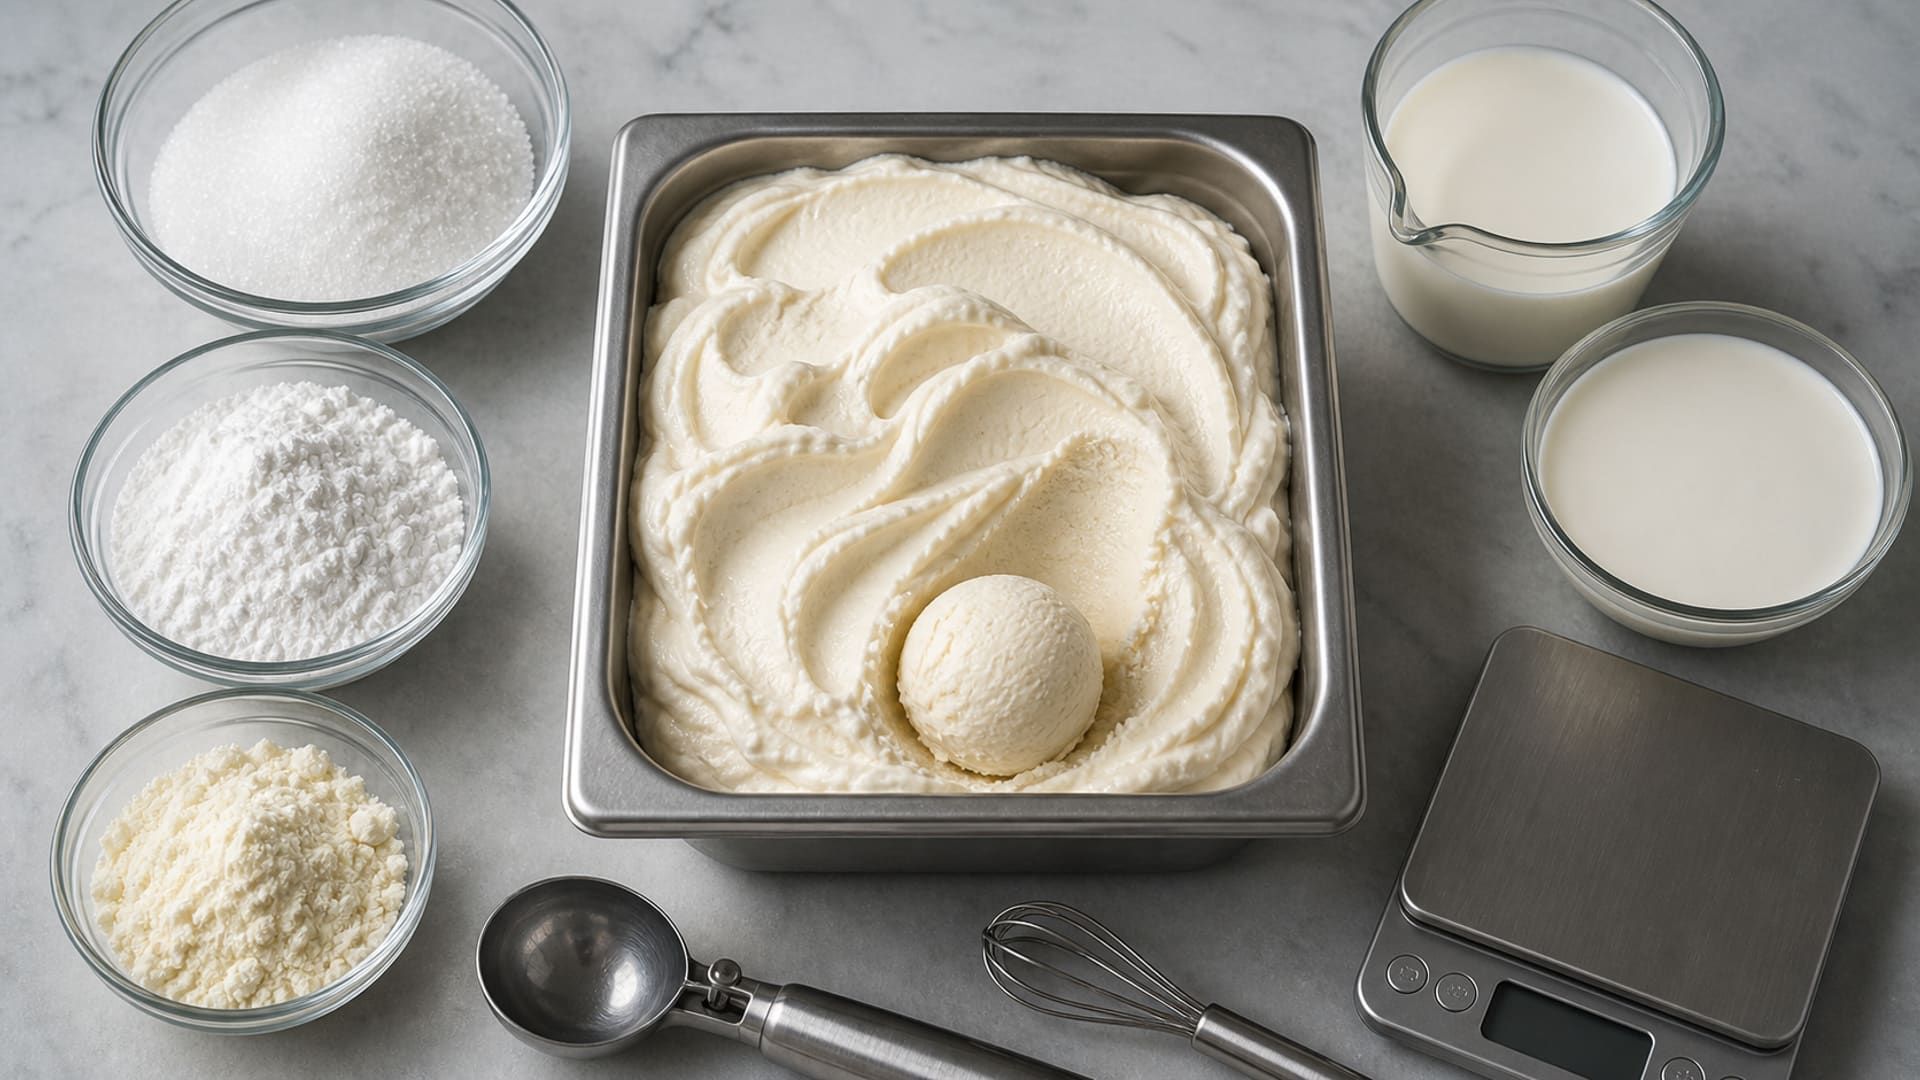
| Whole milk, 3.5% fat | 660 g | Water, lactose, MSNF, and dairy flavour |
| Cream, 35% fat | 100 g | Milk fat and body |
| Skimmed milk powder | 40 g | MSNF, lactose, protein, and solids |
| Sucrose | 145 g | Sweetness, solids, and baseline PAC |
| Dextrose | 50 g | Raises PAC with less sweetness than sucrose |
| Guar gum | 2 g | Viscosity and recrystallization control |
| Mono- and diglycerides of fatty acids (E471) | 3 g | Emulsification and air/fat structure |
Worked 1,000 g fior di latte formula used for the calculator outputs below.
The comparison uses the saved 1 kg formula with the gelato style, batch-freezer method, serving target −11°C and 30% target overrun. These are calculation settings. Use a validated heat-treatment and cooling procedure for the actual mix; the settings do not constitute a pasteurization or freezer operating instruction.
The current model places its 69% frozen-water reference near −12.4°C for this mix; the entered serving target remains −11°C. These are different quantities. At −11°C it predicts about 65.5% frozen water, which is the common comparison point used below.
The computed curve has a concentration limit and does not cover every colder storage condition. Use the returned range as it stands. A setting of −16°C does not by itself provide a validated model prediction at that temperature.
Open the 1 kg fior di latte baseline
Inspect the exact sugar blend, calculation settings and process, then copy the recipe into your account.
Balance PAC, POD, and Solids in Four Steps
Set product and temperature
Choose gelato, sorbet, or ice cream; define the actual serving and storage temperatures, batch-freezer method, and overrun. A number copied from another style is not a target for yours.
Calculate every sugar contribution
Count sucrose and dextrose plus lactose from milk and milk powder, sugars in fruit or chocolate, and dry matter in syrups. Apply PAC and POD coefficients on the same declared solids basis.
Change PAC while protecting POD and solids
Adjust the blend in small steps. If sweetness is already high but the scoop is hard, replacing part of sucrose with dextrose can raise PAC while lowering POD; if total sugar is removed, rebuild the lost solids deliberately.
Validate the physical outcome
Pasteurize under the validated food-safety plan, mature, freeze, harden, equilibrate, and test at the real serving temperature. Record product temperature, draw behaviour, overrun, hardness, melt, iciness, and sweetness.
Use one coefficient system throughout a comparison. Anhydrous dextrose and dextrose monohydrate do not contribute identical dry matter per kilogram, and commercial glucose syrup contains water plus a distribution of saccharides. If the ingredient record changes, recalculate before interpreting the trial.
PAC is relative bookkeeping, not a direct temperature equation. The physical freezing curve depends on dissolved particles in the water phase, milk salts, non-ideal concentration effects, and continuous freeze concentration as ice forms. Use PAC to compare nearby formulations; use a validated freezing model or measurement when absolute ice fraction is critical.
See the Sugar Contributions and the Two Edits
POD and PAC are quoted here per kilogram of mix. Do not compare them with an index reported per 100 g without converting the basis. For the baseline, the sugar-species contributions give the following check on the displayed totals.
| Contribution from the ingredient records | POD contribution | PAC contribution |
|---|---|---|
| Sucrose species | 144.710 | 144.710 |
| Glucose species | 35.250 | 89.300 |
| Lactose species | 8.925 | 55.780 |
| Total, rounded | 188.885 | 289.790 |
Contribution arithmetic for this formula and this coefficient convention.
For example, the recorded glucose contribution is 47 g. At relative POD 75 and PAC 190 it contributes 47 × 0.75 = 35.25 POD units and 47 × 1.90 = 89.30 PAC units. The three sugar species add up to the reported PAC: milk salts are not part of the index.
Now replace 20 g of the sucrose ingredient with 20 g of the dextrose ingredient, or reverse that change. Everything else, including the 1,000 g input mass and −11°C serving target, stays fixed. The table contains actual simulation outputs, not invented tasting results.
| Recipe variant | Sucrose / dextrose | POD | PAC | Total solids | Predicted frozen water at −11°C |
|---|---|---|---|---|---|
| More sucrose | 165 g / 30 g | 194.7 | 274.0 | 36.0% | 67.1% |
| Baseline | 145 g / 50 g | 188.9 | 289.8 | 35.9% | 65.5% |
| More dextrose | 125 g / 70 g | 183.0 | 305.5 | 35.8% | 63.8% |
All rows are model calculations with the same remaining ingredients and settings.
More sucrose: 165 g / 30 g
Open the saved comparison with 165 g sucrose and 30 g dextrose; the remaining ingredients and settings match the baseline.
More dextrose: 125 g / 70 g
Open the saved comparison with 125 g sucrose and 70 g dextrose; copy it to run your own nearby trial.
The more-dextrose edit raises PAC by about 15.8 units and lowers POD by about 5.9. The predicted frozen-water fraction falls by about 1.6 percentage points at the same temperature. That gives a direction for a trial when the baseline is too hard or too sweet; it does not establish that the edited mix tastes better.
Total solids are close but not identical. The selected dextrose record carries more water than the sucrose record, so equal ingredient mass is not equal dry mass. This is why the calculator must use the supplied ingredient form rather than assuming pure anhydrous sugars.
Milk minerals do not enter the PAC index: the freezing-curve calculation counts them from the milk solids-not-fat, separately from the sugars. Never convert the PAC number directly into a temperature.
Validate Scoopability in the Real Process
The calculator narrows the search space; the freezer decides whether the prediction transfers. Compare pilot batches only after they have the same ageing, dynamic freezing, hardening, storage, and equilibration history.
Measure product temperature
Measure the gelato itself at the scoop point. Cabinet air temperature cycles and does not equal product core temperature.
Record draw and overrun
Weigh a known volume before and after freezing or use the plant's validated method. A 30% target must be checked rather than inferred from dasher settings.
Score the scoop after equilibration
Use the same scoop, portion, operator method, and product temperature. Record resistance, curl, fracture, and recovery rather than only ‘too hard’ or ‘too soft’.
Check melt and flavour
Observe drainage, foam collapse, iciness, gumminess, and sweetness as the sample warms. A soft scoop with weak body is not a successful PAC adjustment.
Repeat after storage stress
Test the intended shelf period and realistic temperature cycling. PAC does not prevent recrystallization caused by a broken cold chain.
Frequently Asked Questions
What is PAC in gelato?
What PAC should gelato have?
How can dextrose make gelato less sweet but softer?
Should I optimize the POD/PAC ratio?
Why is my gelato still hard when PAC looks correct?
Can I use PAC instead of a freezing curve?
References: Goff and Hartel, Ice Cream, 7th edition (2013), for freezing, mix composition and processing. The tables use the current Formul.io calculation of this saved formula and the two stated ingredient edits. They do not represent a freezer trial or a measured serving recommendation.
Related Topics
Related Articles
POD and PAC Values for Ice Cream Sugars, with Calculator
POD and PAC values for sucrose, dextrose, fructose, invert sugar, lactose, glucose syrup and polyols, a free sugar-balance calculator, and how to read the totals.
Gelato vs. Ice Cream: Formulation Science Explained
Fat content, overrun, PAC/POD targets, and stabilizer strategy diverge sharply between gelato and ice cream. Understanding why each lever differs is the foundation of formulating either product correctly.
Ice Cream Too Hard or Icy? Find the Cause and Fix It
Rock-hard straight from the freezer and icy after a week are two different faults. Diagnose which one you have, then fix it with sugar swaps, stabilizer and storage.